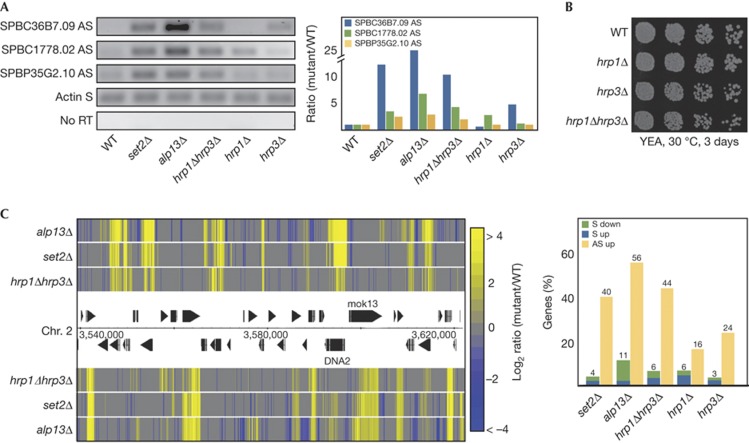
Figure 1.
hrp1Δhrp3Δ cells accumulate AS transcripts. (A) Gel electrophoresis (left panel) of strand-specific reverse transcription and PCR amplification of the indicated S and AS transcripts in WT and mutant strains. Total RNA from the indicated strains was reverse transcribed using strand-specific primers, and the resulting complementary DNA was amplified by PCR. Controls lacking reverse transcriptase were used to exclude DNA contamination (no RT). The chart (right panel) indicates quantification of the PCR transcripts normalized to the amount of actin S transcripts (WT set to 1). (B) Growth of indicated strains in a series of fivefold dilutions on YEA plates. The cells were incubated at 30 °C for 3 days. (C) Heat map (left panel) showing a portion of the S. pombe genome demonstrating relative levels of transcripts from the forward (upper panel) and reverse (lower panel) directions in the indicated strains compared with WT. Colours represent up- or downregulation of gene expression on a log2 scale. The chart (right panel) shows genome-wide statistics of changes in S and AS transcript levels for the indicated strains compared with WT. AS, antisense; Chr., chromosome; RT, reverse transcriptase; S, sense; WT, wild-type.

