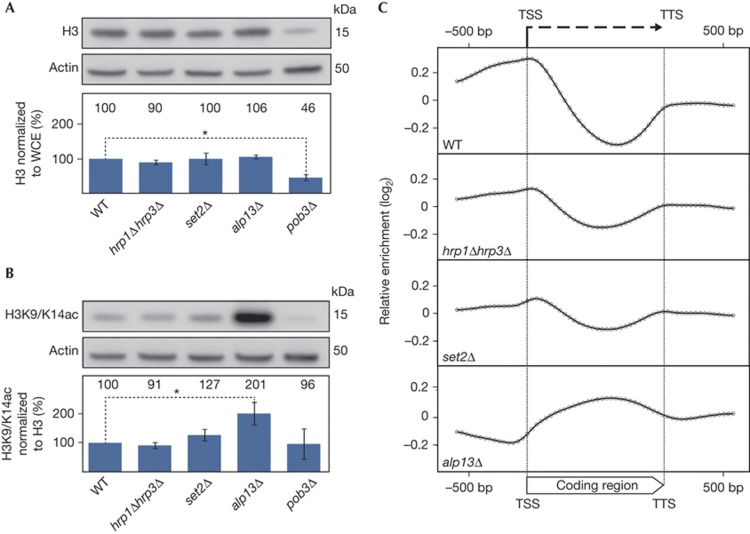
Figure 2.
Coding regions are not hyper-acetylated in hrp1Δhrp3Δ. (A) WCE were subjected to SDS–polyacrylamide gel electrophoresis and H3 levels were monitored by western blot. The relative H3 levels were quantified and normalized to the total protein content of the WCE (chart, lower panel) and WT was set to 100%. (B) Western blot analysis of the same WCEs using a polyclonal antibody recognizing both acetylated H3K9 and H3K14 (H3K9/K14ac). The relative H3K9/K14ac levels were quantified and normalized to levels of H3, with WT set to 100% (chart, lower panel). For (A) and (B), data represent the means of three independent experiments and error bars represent s.d. *Indicates statistical significance using Student’s t-test (P<0.05). (C) Composite plot of ChIP-on-chip analyses using the anti-H3K9/K14ac antibody in WT and indicated mutant strains. H3K9/K14ac relative enrichment values were determined in a genome-wide ChIP-on-chip experiment with 2,320 genes represented on the array. Each gene was divided into 30 parts (bins) and the average relative enrichment value was determined for each bin. In addition, 600 bp from both the flanking 5′ and 3′ regions were included in the analysis. The average of the log2 values of each of these bins (geometric mean) was calculated and plotted on a log2 scale, where each dot represents a bin. bp, base pairs; ChIP, chromatin immunoprecipitation; TSS, transcriptional start site; TTS, transcriptional termination site; WCE, whole-cell extracts; WT, wild-type.

