Figure 3.
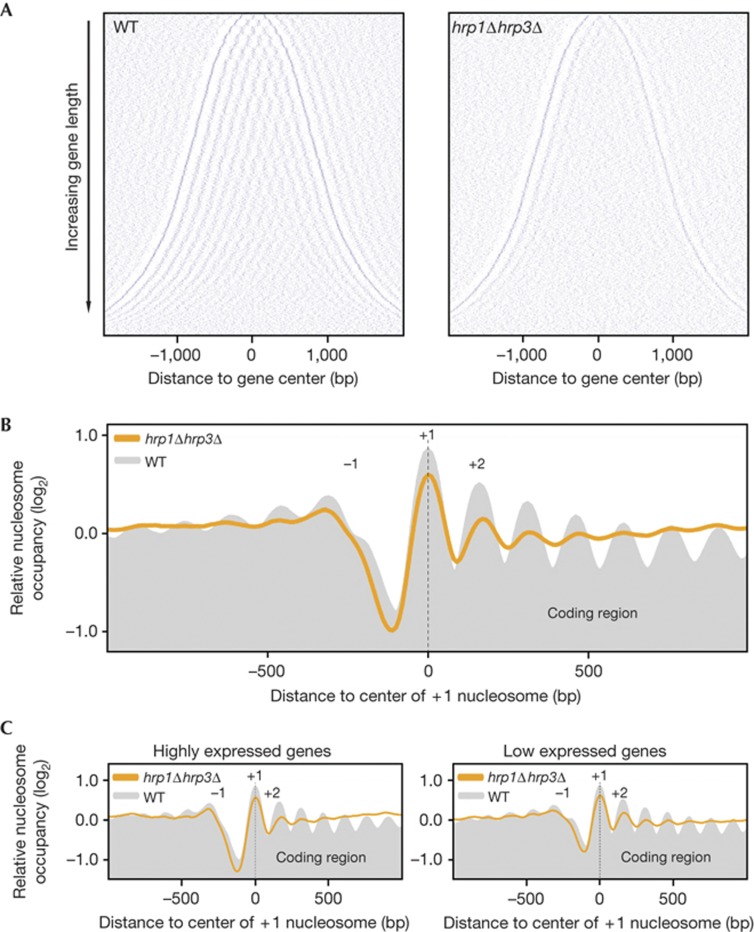
The regularly organized nucleosome arrays in gene coding regions are disrupted in the hrp1Δhrp3Δ strain. (A) Two-dimensional plots of nucleosomes along 3,778 genes in WT and hrp1Δhrp3Δ strains. Positions of the first and last nucleosomes were determined for each gene in an independent experiment with the WT strain. These annotations were used for the analysis of all data sets. Each row represents a gene; genes were sorted vertically (shortest at the top and longest genes at the bottom) according to the distance between the first and last nucleosome of the gene and were aligned at the mid point. Blue dots correspond to the centre of identified nucleosomes. (B) Composite plots of relative nucleosome occupancy for the WT (grey shading) and the hrp1Δhrp3Δ mutant (orange line). Using the same annotation from the independent WT data set, 3,778 genes were aligned at their first annotated nucleosome and the average of their log2 nucleosome occupancy data (geometric mean) was plotted. (C) The genes represented in (B) were sorted according to gene expression levels, and composite plots were generated for the highest expressed 25% of genes (left) and the lowest expressed 25% of genes (right). bp, base pairs; WT, wild-type.

