Figure 5.

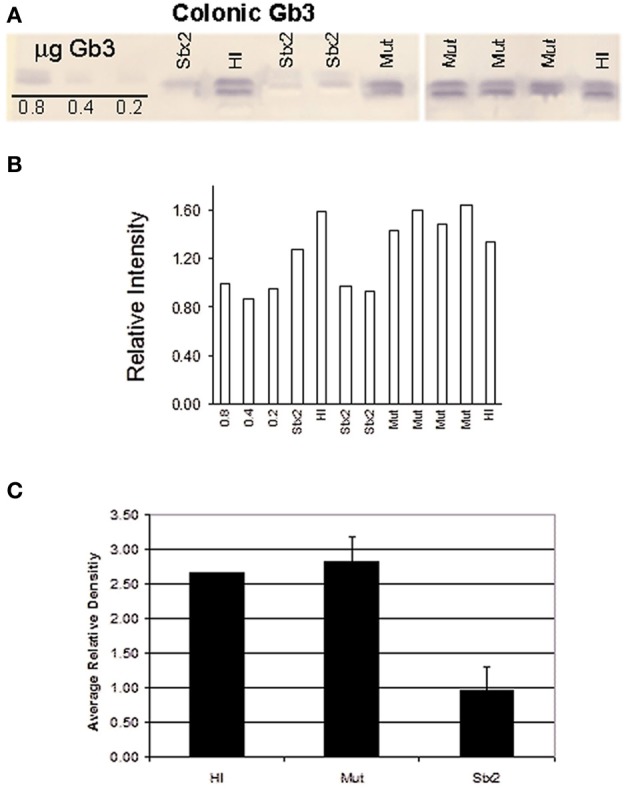
(A) Thin layer chromatography of extracted lipids from the distal colon tissue of 2 HI, 4 Mut-, and 3 Stx2-treated infant rabbits. Gb3 was detected using a Shiga toxin 1 B-subunit overlay method (Nutikka et al., 2003). Standards of 0.8, 0.4, and 0.2 μg Gb3 are shown on the far left of the TLC plate. (B) TLC band density for each sample was determined using ImageJ 1.38× software (Rasband, 1997–2007). (C) Mean density values were plotted for each treatment group. Error bars represent the standard deviation.
