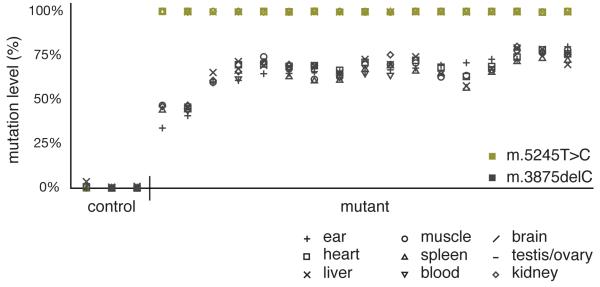
Figure 1.
Levels of heteroplasmy in nine different tissues from three control and 17 mutant adult mice after at least seven generations of backcrossing, showing the homoplasmic m.5245T>C (green) and heteroplasmic m.3875delC (black) mutations. Note that the level of heteroplasmy is similar in all tested tissues.

