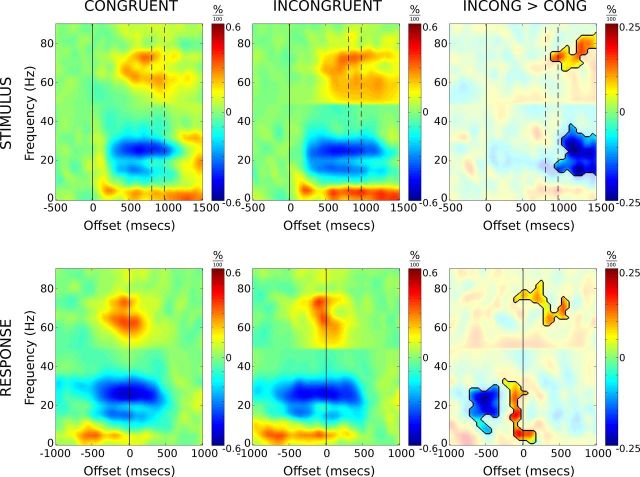
Figure 1.
Average time–frequency spectrograms for congruent and incongruent correct response trials, time-locked to stimulus presentation (top row) and verbal response (bottom row). Spectrograms represent power as proportion change values relative to their respective baseline regions. The third column depicts difference spectrograms with incongruent > congruent. Difference spectrograms are masked to highlight regions in which paired t tests remained significant after correction for multiple comparisons (see main text for details). The dashed vertical lines denote mean congruent (807 ms) and incongruent (980 ms) reaction times. Note the extended beta suppression on incongruent versus congruent trials, and the rebound just before response onset.

