
Figure 3.
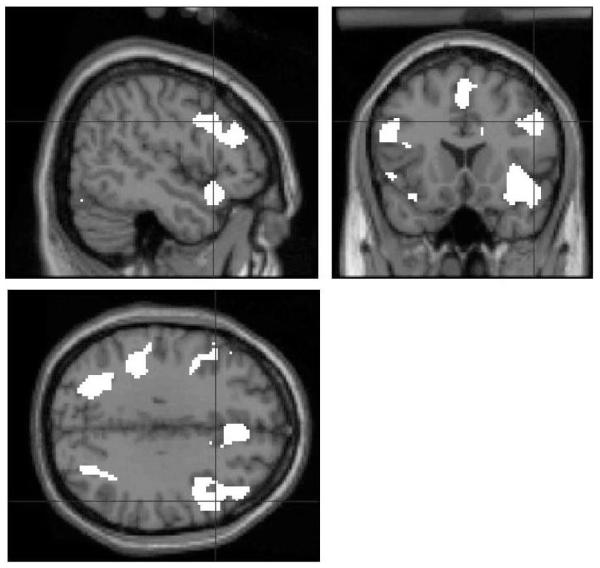
A comparison of all single cue-outcome learning events with the fixation baseline events in stage 1. The main effect of associative learning to single foods from stage 1 using SPM (P < 0.001) rendered onto structural MRI in standard space with sections at x, y, z = 50, 18, 32. This contrast was used as a mask for all further comparisons.