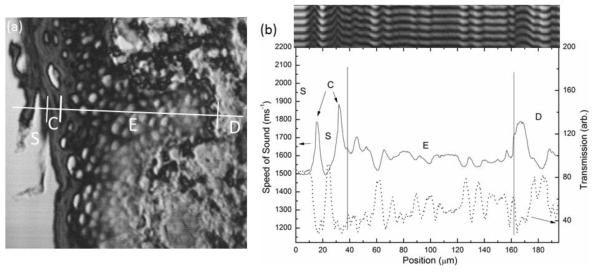
Fig. 5.
SAM image showing a line profile through the different histological layers of the skin; glass substrate (S), cornified layer (C), epidermis (E) and dermis (D) (b) Speed of sound (solid line) and transmission signal (dotted line) values shown across these layers. Inset: reconstructed V(x, z) image.

