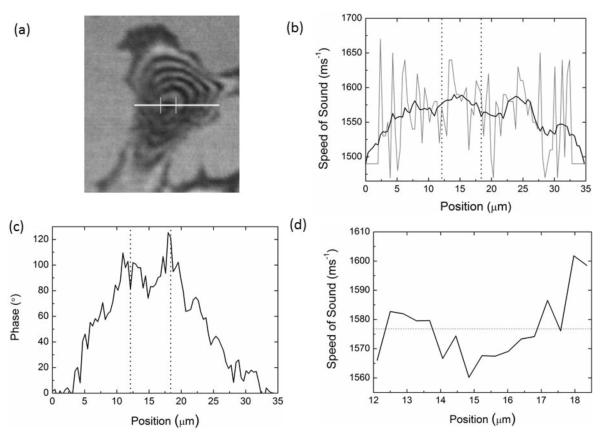
Fig. 6.
Comparison of V(f) and MLPA for cells. (a) Typical SAM image of a NIH3T3 mouse fibroblast with line profile marked for analysis (b) Sound speed as a function of position with the V(f) method. The grey line shows the actual values with the smoothed data shown in black. (c) Phase value as a function of position and (d) Sound speed determined from the phase data with the MLPA method.

