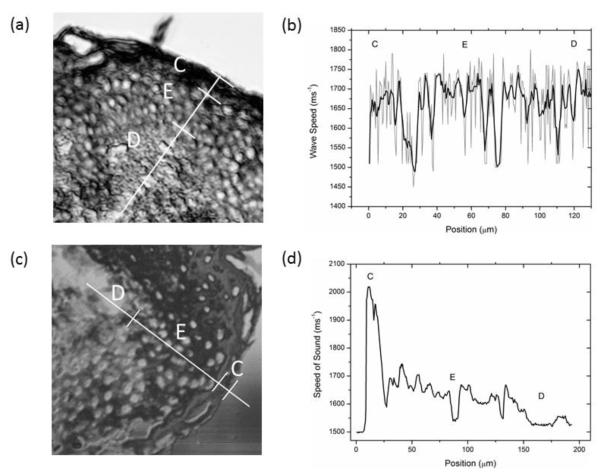
Fig. 7.
Comparison of V(f) and MLPA for skin. (a) Typical SAM image collected with the V(f) method with line profile marked for analysis (b) Sound speed as a function of position determined with the V(f) method. The grey line shows the actual values with the smoothed data shown in black. (c) Typical image from MLPA stack and (d) Sound speed profile determined with the MLPA method. The data collected with the latter method is less noisy and shows a clear transition in sound speed from the cornified layer (C) through to the epidermis (E) and dermis (D).

