Figure 3.
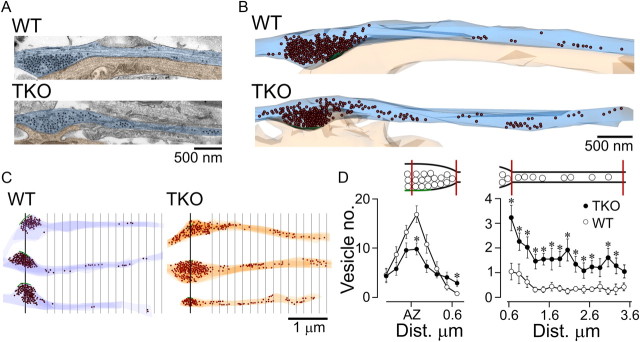
Ultrastructural examination of dispersal of synaptic vesicles in neurons lacking synapsins. A, Longitudinal sections through presynaptic contacts and flanking axonal segments (light blue) abutting upon postsynaptic targets (light orange) in WT and synapsin TKO neurons from hippocampal cultures. The synaptic contacts are aligned at the left of the image. The centers of synaptic vesicles are marked by black dots; clustering of vesicles is evident. B, Three-dimensional reconstruction of the synapses shown in A, with vesicles represented by brown spheres. C, Further examples of synapse–axon reconstructions for WT and TKO neurons. The green line represents the center of the active zone. Distance markers at a spacing of 200 nm are shown starting at 550 nm from the center of the active zone, which marks the average boundary of the vesicle cluster in WT synapses. Notice the larger presence of vesicles in the axons of synapsin TKO neurons. D, Vesicle density within the presynaptic terminal (left) and along the axon (right, mean ± SEM). Compared with WT, the average number of vesicles near the active zone in TKO neurons is significantly lower, but at distances larger than ∼400 nm from the center of the active zone, this relationship is reversed. The number of vesicles in the axon is consistently higher in synapsin TKO neurons. *p < 0.02, Mann–Whitney test in both graphs. The schematics above the plots indicate the regions of presynaptic terminal and axon being examined.

