
Figure 7.
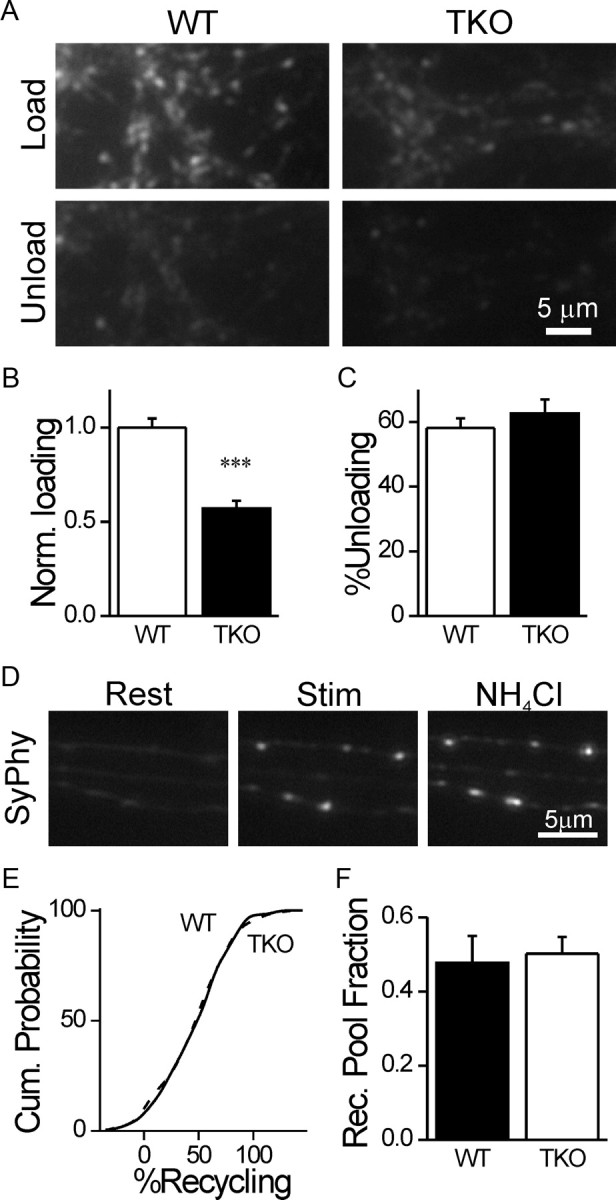
Subdivision of vesicles into resting and recycling pools is unaffected by the synapsins. A, Synapses loaded with FM1–43 (top) in WT (left) and synapsin TKO (right) neurons. Notice the brighter signal in WT neurons. The same fields are shown after unloading (bottom). B, Normalized intensity of FM1–43 intensity in loaded terminals (mean ± SEM), as shown in A. C, Percentage of FM1–43 unloaded by hyperkalemic stimulation. D, Representative images of synapses of WT neurons expressing Synaptophysin I-2XpHluorin at rest (left), after the recycling pool is revealed by hyperkalemic stimulation in the presence of bafilomycin A (middle), and after the total pool is visualized by alkalinization of all vesicles by NH4Cl saline (right). E, Cumulative probability plots of the fraction of the recycling pool out of the total population for all synapses analyzed. The plots overlap. F, Average of the mean values obtained from independent experiments. No difference is observed between WT and TKO neurons. ***p < 0.001, Student's t test.