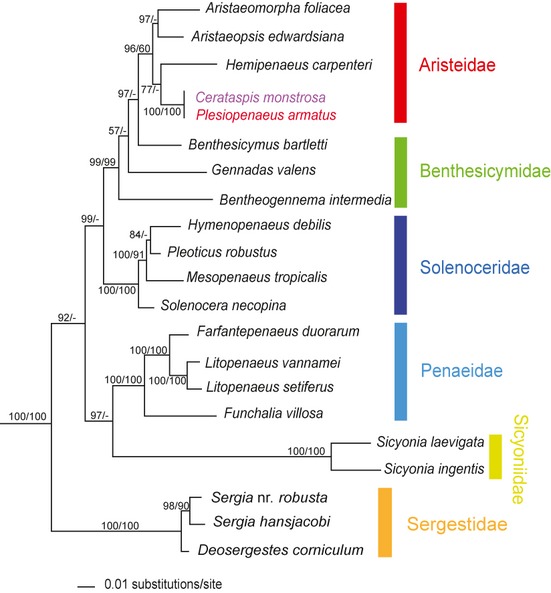
Figure 2.

Bayesian (BAY) phylogram for selected dendrobranchiate taxa (n = 21) and outgroups (n = 6) based on a 12S (mtDNA), 16S (mtDNA), 18S (nDNA), 28S n(DNA) and H3 n(DNA) concatenated dataset. BAY posterior probabilities and ML bootstrap values are represented as percentages and noted above or below the branches (BAY/ML). Values <50% are not shown and represented by “-” Vertical colored bars indicate families within Decapoda. Outgroups not shown.
