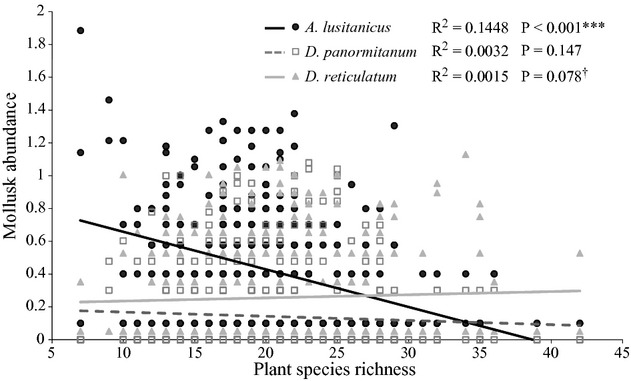
Figure 3.

The relationship between plant species richness and mollusk abundance (log transformed) for Arion lusitanicus (black circles and line, to avoid over-plotting, a value of 0.1 was added), Deroceras reticulatum (light gray triangles and light gray line, a value of 0.05 was added) and Deroceras panormitanum (white squares and dashed line), over the two seasons of the years 2008 and 2009, within the (+) mollusk plots. Regression lines give the fitted linear model for each species. Significances calculated using linear mixed effect models.
