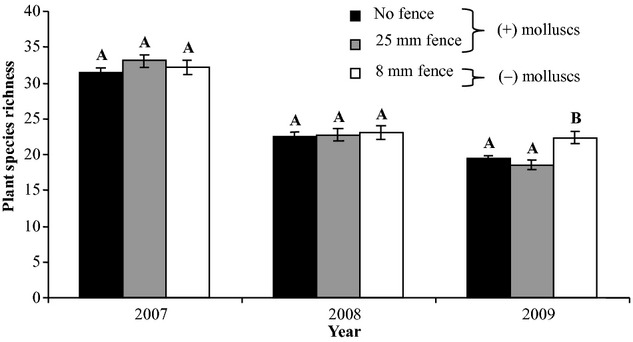
Figure 6.

Average number of plant species for the three fence treatments for each year. Significant differences (P < 0.05) between fence treatments within a year are represented by different letters (A−B) calculated by multiple comparisons for parametric linear mixed effect models. Error bars represent the standard error of the mean from a total of 48 plots in the 12 wildflower strips.
