Figure 8.

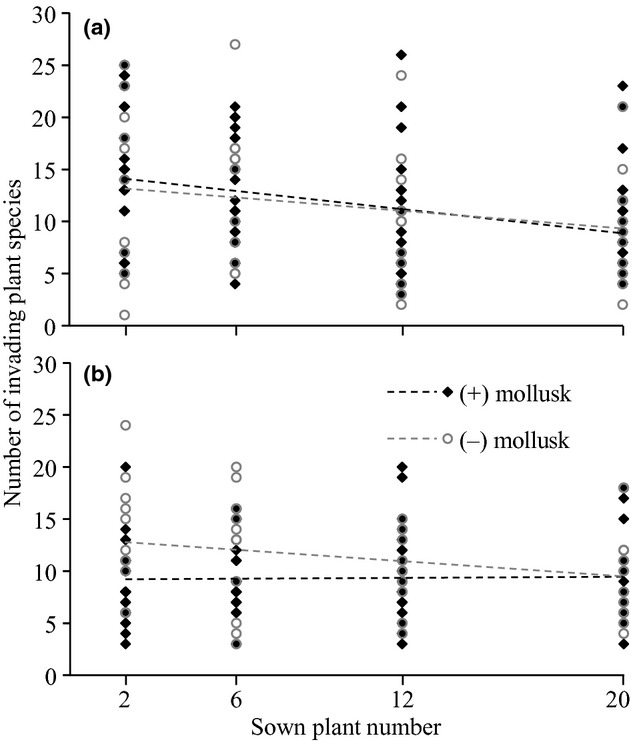
The relationship between the number of sown and invading plant species in (+) and (−) mollusk plots in the years (a) 2008 and (b) 2009.

The relationship between the number of sown and invading plant species in (+) and (−) mollusk plots in the years (a) 2008 and (b) 2009.