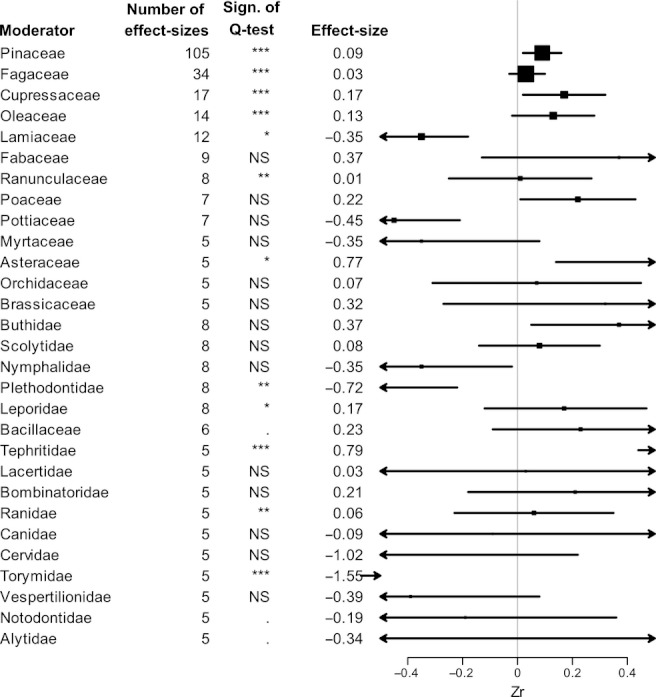
Figure 3.

Mean effect-sizes across the Mediterranean basin for 12 plant and 17 animal families, arranged in decreasing effect-size number per category. Of 62 possible families represented in the dataset, only the 29 with a number of effect-sizes over 5 are represented here. Square and error bars should be interpreted as indicated for Fig. 2a.
