Figure 1.

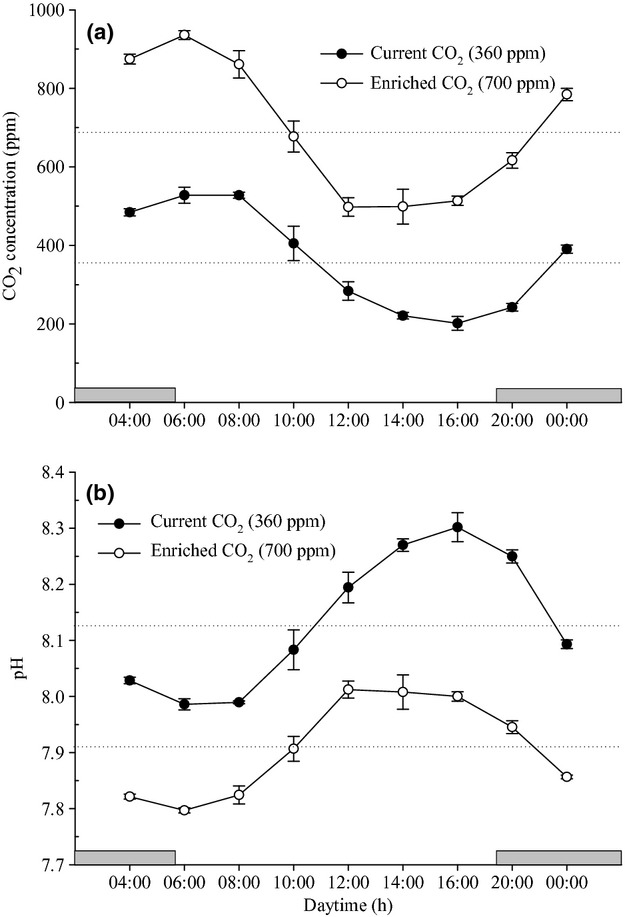
Daily fluctuation of (a) CO2 concentration (ppm) and (b) pH of the seawater in the control (open circle) and the CO2-enriched (closed circle) treatments. Dark areas represent nighttime. Values are mean ± SD (n = 6).

Daily fluctuation of (a) CO2 concentration (ppm) and (b) pH of the seawater in the control (open circle) and the CO2-enriched (closed circle) treatments. Dark areas represent nighttime. Values are mean ± SD (n = 6).