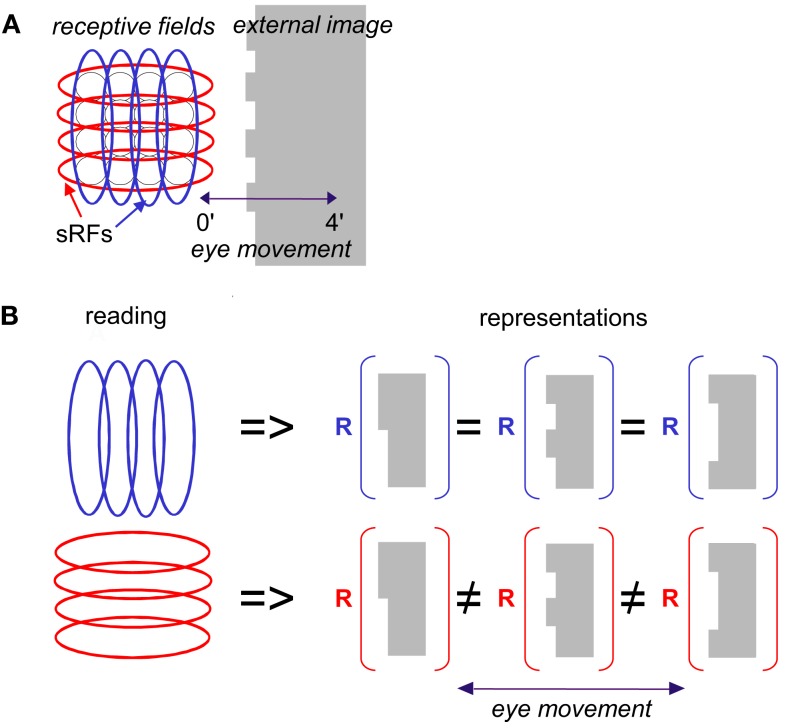
Figure 2.
Scanning of a stationary edge by drift. (A) Retinal mosaic (as in Figure 1) scans a stationary object whose left edge is patterned during a horizontal drift. The peak-to-peak amplitude of the horizontal projection of FeyeM is 4′. Retinal ganglion RFs are indicated by black circles, and sRFs with horizontal (red) and vertical (blue) orientations are indicated by ellipses. (B) Scanning along the long axes of sRFs increases spatial resolution. In this example, reading sRFs oriented parallel to the global orientation of the patterned edge of an external image (blue) cannot generate different representations (R) for different edge patterns, whereas reading sRFs oriented perpendicular to the edge (red) can (using temporal coding).

