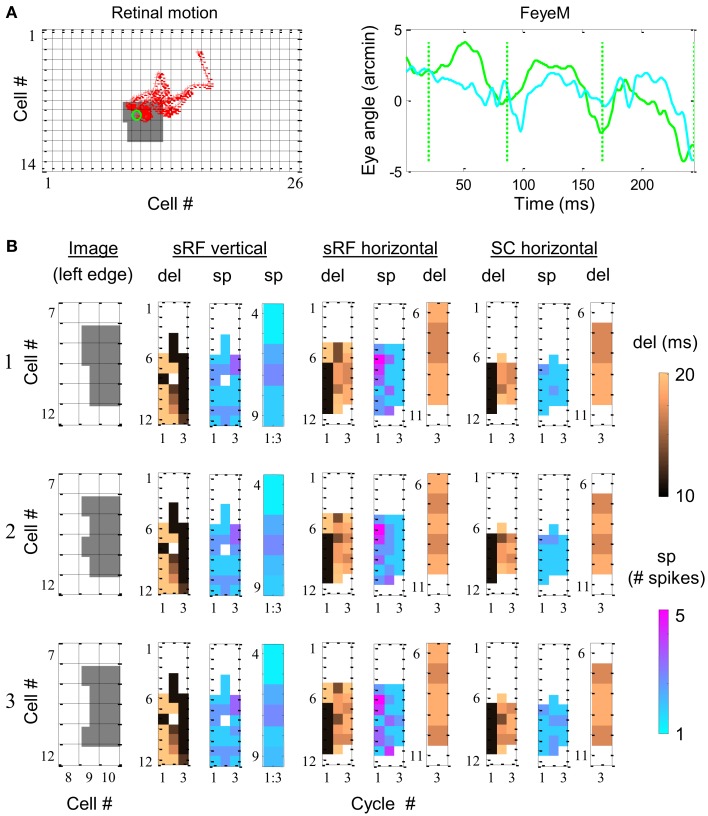
Figure 7.
Simulation of phase encoding and recoding of a stationary image with human FeyeM. (A) FeyeM recorded from a human subject fixating on a cross (same example as in Figure 1A) were used to shift a stationary image over a retinal array of 14 × 26 OFF photoreceptors (left panel, retinal movement trajectory plotted in red; starting point circled in green). FeyeM cycle onsets were defined as the minima of a low-pass (cutoff frequency: 40 Hz) version of the horizontal trace (right panel, dotted vertical green lines). Size of all retinal RFs was set arbitrarily to 2′. (B) Dynamics of delay (del) and spike count (sp) across the three cycles of the FeyeM epoch in three columns of cells (vertical sRF, horizontal sRF and horizontal SC) and for three external images [rows 1–3, left edges of the images are depicted in the left panel of each row, the rest of the image was identical to the one in (A)]. Sp responses in vertical sRFs (mean over the three cycles) and del responses at the third cycle of sRFs and SCs are enlarged for the relevant cells. FeyeM data courtesy of Dr. Moshe Fried.

