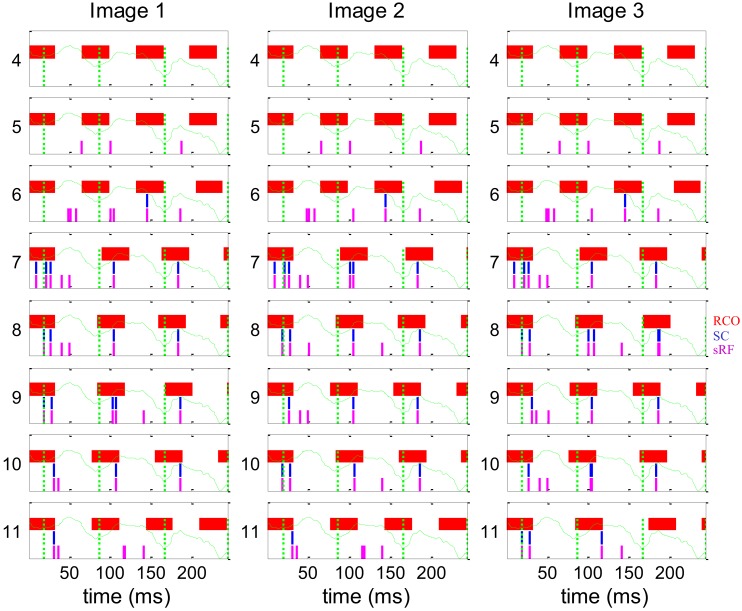
Figure 8.
Dynamics of the encoding-decoding process. The spike trains of RCO (red vertical lines), SC (blue vertical lines), and sRF (magenta vertical lines) units are shown for the simulations presented in Figure 7. The horizontal trace of FeyeM is depicted in green. Vertical dotted green lines mark cycle onset. Eight units (y = 4–11) are depicted along one column (x = 10). Conduction delays were simulated as zero. Initial RCO frequency was 0.8 of the mean horizontal FeyeM frequency (12.3 Hz) and the open-loop gain was −5.

