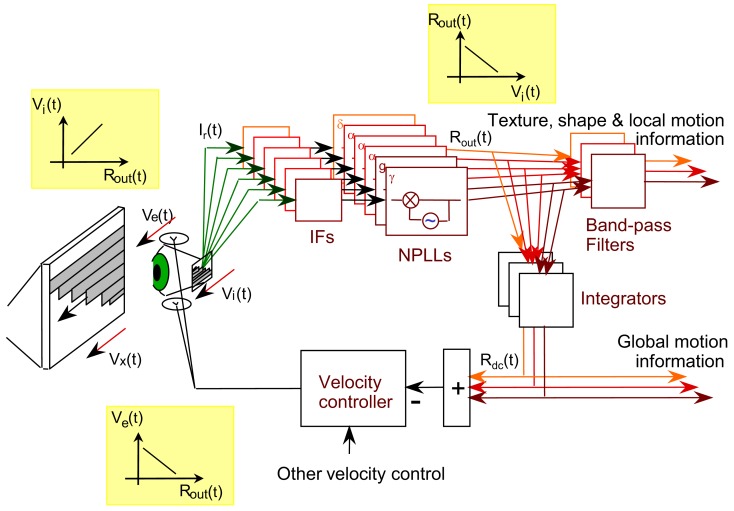
Figure 9.
Schematic diagram of a motor-sensory visual loop containing a bank of NPLLs of different intrinsic frequencies. Vx, Ve, Vi, velocities of an external object, the eye, and the retinal image, respectively; IF, intermediate filter that is centered around the working frequency of its corresponding NPLL; δ, α, γ, the frequency range containing the intrinsic frequency of an NPLL. The major transfer functions dominating the loop are described in the three insets: Rout is the output firing rate of an NPLL.

