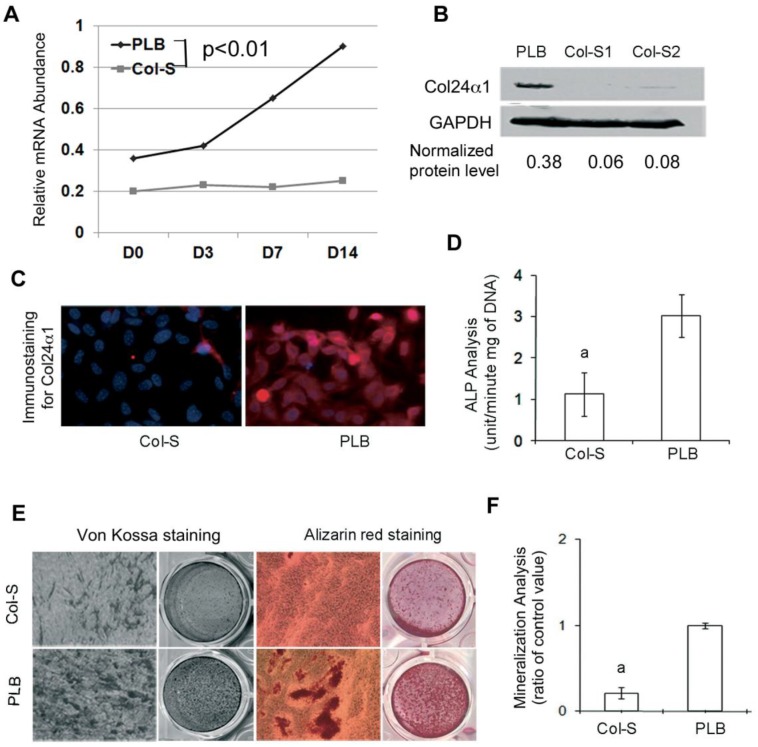
Fig 2.
Silencing Col24α1 blocks osteoblast differentiation and mineralization. (A) Quantitative real-time RT-PCR analysis. MC3T3-E1 cells were infected with Col-S or PLB lentiviruses for 48 hrs, and then induced with OS media for 0, 3, 7, 14 days. The mRNA levels of Col24α1 gradually increase in control cells over time as compared to control cells, which are significantly lower. N=6, p < 0.05; PLB vs Col-S at all time points. (B) Western blot analysis of Col24α1 protein expression. The cells were treated as described in A. The level of Col24α1 in the silenced groups was 5.6 fold (Col-S1) and 4.6 fold (Col-S2) lower than that in the control. (C) Immunofluorescence staining revealed that the expression of Col24α1 was diminished in Col-S cells at day 7 after infection. (D) ALP activity. Cells at 70-80% confluence were infected with Col-S or PLB lentiviruses and then induced with OS media for 7 days. ALP activity in the Col-S group was significantly lower than the PLB group. N=6, p<0.05; a: PLB vs Col-S. (E) Alizarin red and Von Kossa staining. MC3T3-E1 were infected with Col-S or PLB lentiviruses for 24 hrs and then induced with OS media for 14 days. Silencing Col24α1 significantly reduces extracellular matrix mineralization. (F) The quantitative analysis of Alizarin red staining as seen in E confirms these results. N=6, p < 0.05; a: PLB vs Col-S. Unless indicated otherwise normalization was performed against GAPDH levels for the control group in the same reaction.

