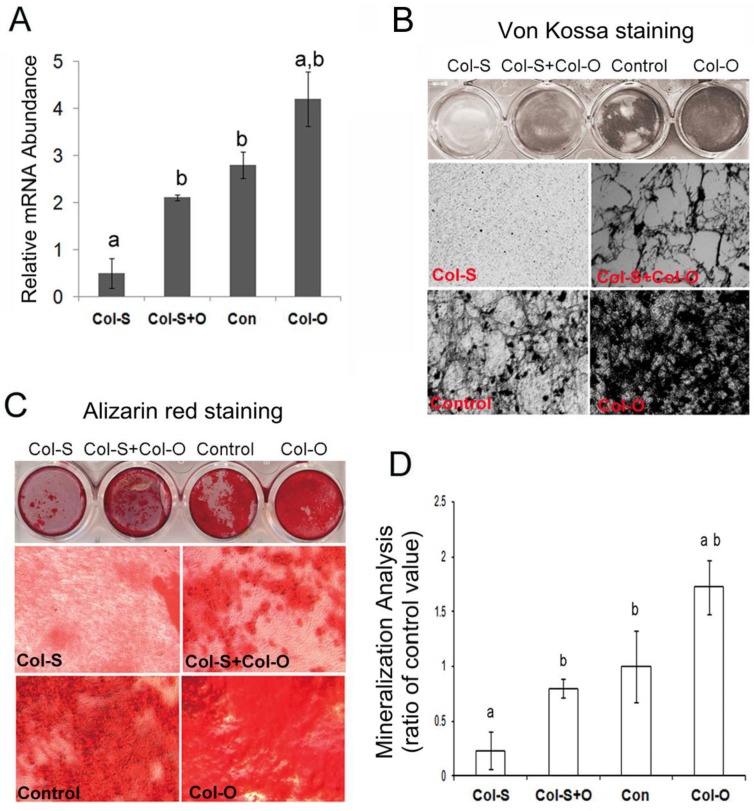
Fig 4.
Ectopic expression of Col24α1 rescues impaired osteoblast differentiation and mineralization resulting from Col24α1 silencing. MC3T3-E1 cells were first infected with Col-S or PLB lentiviruses for 48 hrs and then infected with Col-O or Control retroviruses for an additional 48 hrs. Fresh media was then added and the cells were cultured for the appropriate amount of time based on the given experiment. (A) Quantitative real-time RT-PCR. At 48 hrs cells were harvested and Col24α1 mRNA levels were analyzed. The Col-S group was significantly lower than all other groups. There was no significant difference found between the Col-S+O and Control groups. The Col-O group was significantly greater than all other groups. N=12, p < 0.05; a: Col-S vs all other groups, b: Col-O vs all other groups. (B) Von Kossa staining following induction with OS media for 14 days. There is minimal phosphate ion deposits in the Col-S group, similar levels of mineralization between the Col-S+O and Control groups, and a dramatic increase in the Col-O group. (C) Alizarin red staining following induction with OS media for 14 days. As one might expect, identical results can be seen here as in B. (D) The quantitative analysis of Alizarin red staining as seen in C. Compared to the Col-S group there is a significant increase in mineralization of 3.43 fold and 7.41 fold for the Col-S+O and Col-O groups, respectively. There is no significant difference between Col-S+O and Control groups. N=12, p < 0.05; a: Col-S vs all other groups, b: Col-O vs all other groups. Unless indicated otherwise normalization was performed against GAPDH levels for the control group in the same reaction.

