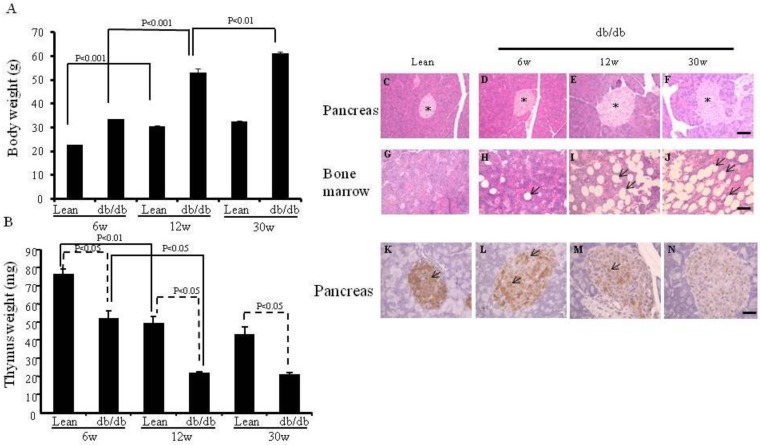
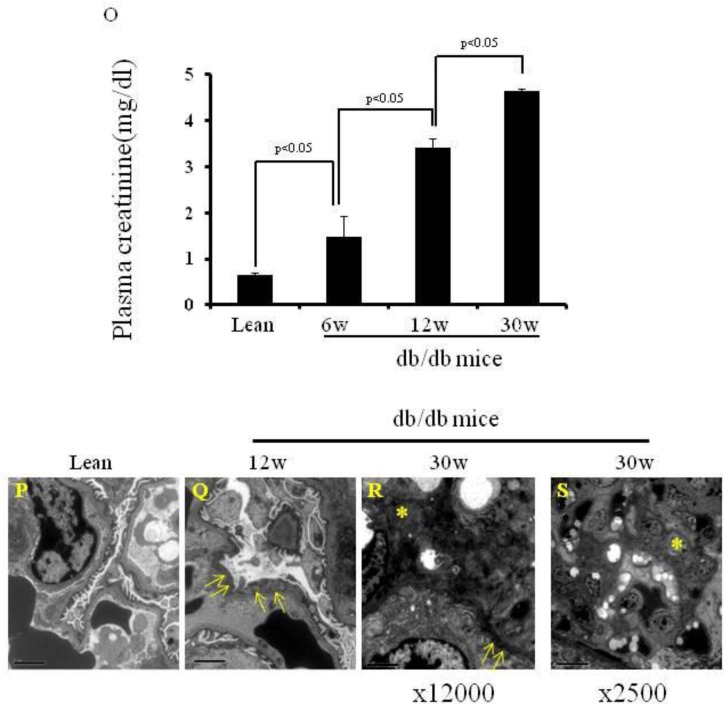
Figure 1.
Body weight, thymus weight and the morphology of pancreas and bone marrow, and expression of insulin on the pancreata, and plasma creatinine levels and images of electron microcopy. (A) Body weights are shown (*p< 0.01). (B) Thymus weights are shown (*p<0.05). (C-J) HE staining of pancreas and bone marrow of the lean and db/db mice at each age. The islets are shown (* in Fig.C-F). The adipocytes are shown in db/db mice (arrows in Fig. H-J). (K-N) Immunochemistry staining for insulin (arrows) was performed. Scale bar =50μm in Fig. C-J, Scale bar =25μm in Fig. K-N. (O) Plasma creatinine levels of lean, (p< 0.05). (P-S) EM of kidneys. Podocyte foot fusion is shown in Fig. 3Q and R (arrows). Electron dense deposits and increased mesangium cells (*) are shown in Fig. 1R and S. Scale bar =2μm in Fig. P-R, Scale bar =10μm in Fig. S. The results are mean±SE, n=6 in each group.


