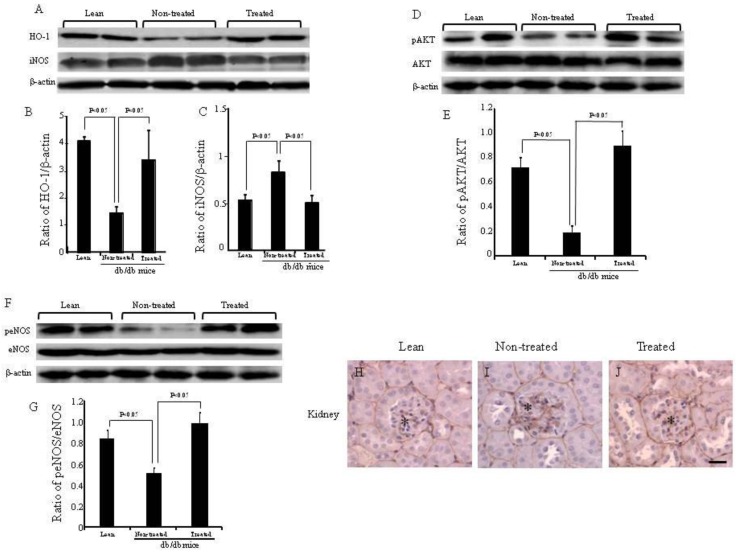
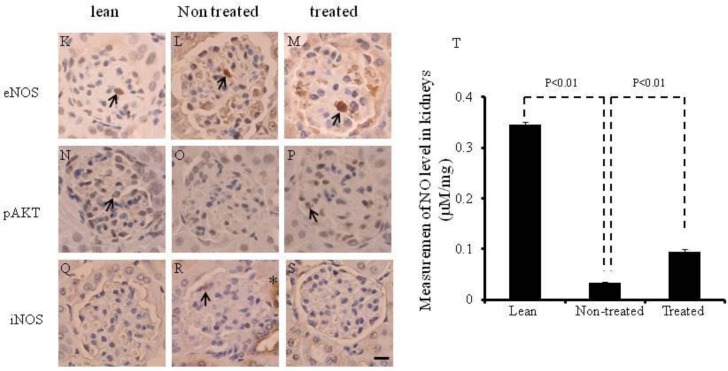
Figure 4.
Expression of HO-1, iNOS AKT, pAKT, eNOS and peNOS in the kidney, and expression of type IV collagen in the kidneys. (A-C) Western blot and densitometry analysis of HO-1, iNOS and actin proteins in kidneys of lean, non-treated db/db mice and treated db/db mice. (D and E) Western blot and densitometry analyses of AKT and pAKT and actin proteins in kidney of lean, non-treated db/db mice and treated db/db mice are shown. (F and G) Western blot and densitometry analyses of eNOS and peNOS and actin proteins in kidney of lean, non-treated db/db mice and treated db/db mice are shown. Representative immunoblots are shown. There were significant differences between non-treated and treated groups (p<0.05). (H-J) Immunochemistry staining for type IV collagen (*). (K-S) Immunochemistry staining for eNOS, pAKT and iNOS. Scale bar =25μm. (T) NO levels in the kidney.


