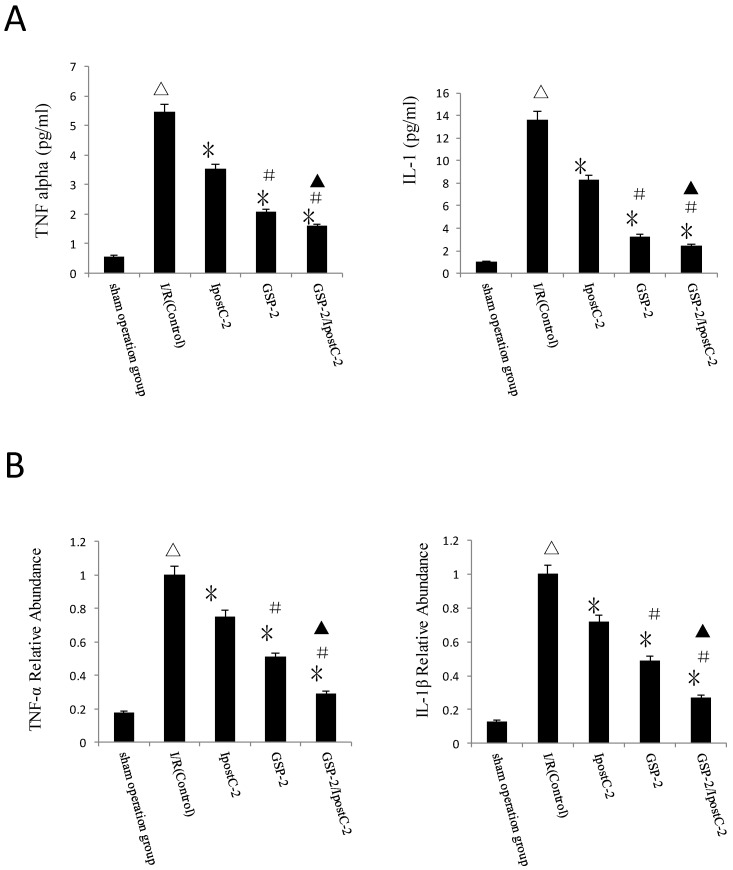
Figure 5.
Cytokines level in mouse serum after IpostC and GSP treatment. (A) TNF-α and IL-1β level were measured in mice serum. (mean±SD, n=10/group). (△indicate P<0.01 when compared with sham group; *indicate P<0.01 when compared with control group; #indicate P<0.01 when compared with IpostC-2 group; ▲indicate P<0.05 when compared with GSP-2 group). (B) TNF-α and IL-1β mRNA abundance in serum were quantified by RT-PCR. (mean±SD, n=10/group). Results obtained with postconditioning, GSP groups and GSP/Ipost were normalized to results obtained with control group, which were given a value of 1. (△indicate P<0.01 when compared with sham group; *indicate P<0.01 when compared with control group; #indicate P<0.01 when compared with IpostC-2 group; ▲indicate P<0.05 when compared with GSP-2 group).

