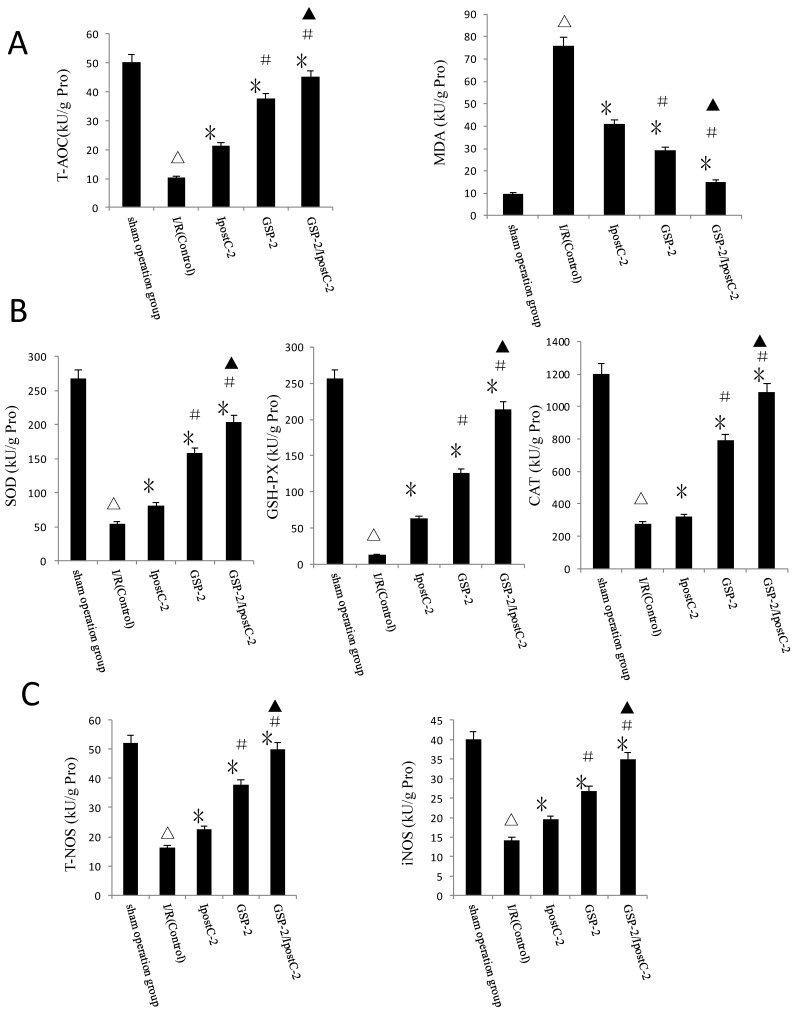
Figure 6.
Effects of ischemic postcondioning protocols and GSP on hepatic oxidative stress. (A)Total antioxidative capacity (T-AOC) and the malondialdehyde (MDA) contents in mouse liver. (mean±SD, n=10/group). (△indicate P<0.01 when compared with sham group; * indicate P<0.01 when compared with IRI control group; # indicate P<0.05 when compared with IpostC-2 group; ▲indicate P<0.05 when compared with GSP-2 group). (B)SOD, CAT and GSH-PX enzymatic activities and (C) T-NOS and iNOS activities in mouse liver. (mean±SD, n=10/group). (△indicate P<0.01 when compared with sham group; * indicate P<0.01 when compared with IRI control group; # indicate P<0.01 when compared with IpostC-2 group; ▲indicate P<0.05 when compared with GSP-2 group).

