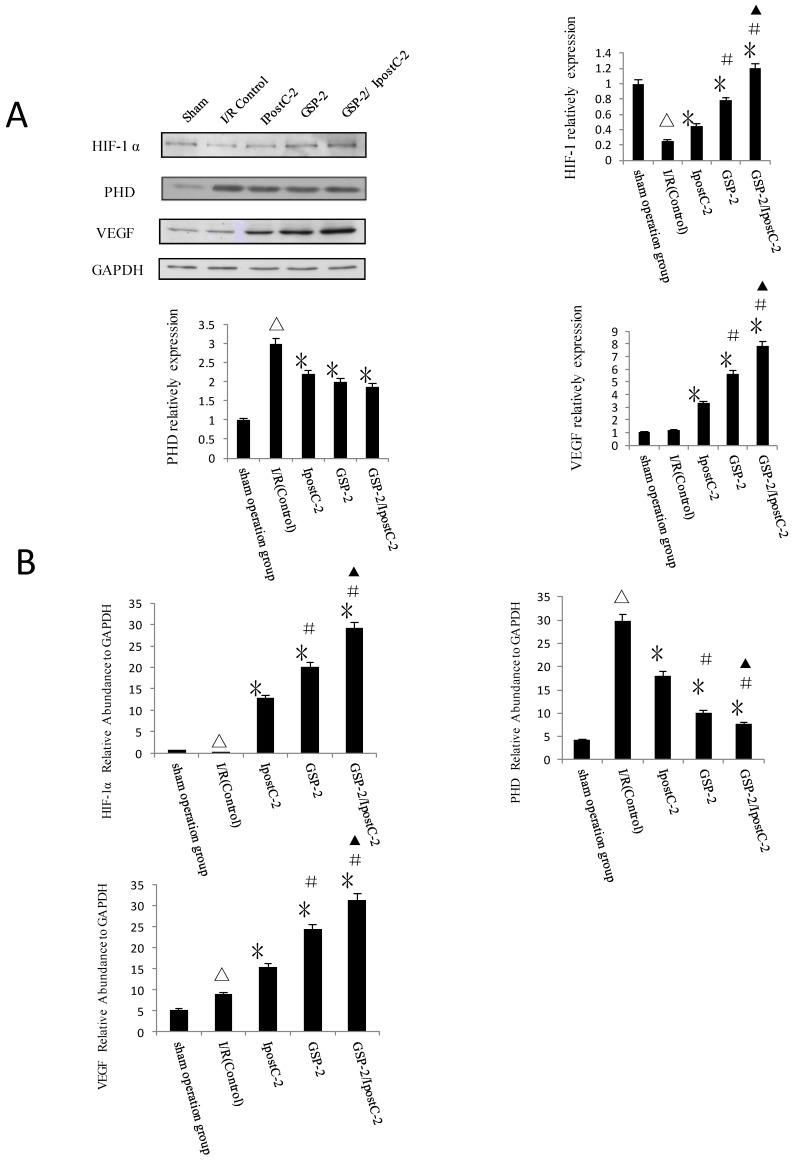
Figure 7.
Effect of postconditioning and GSP on the expression level of HIF-1 alpha, PHD and VEGF. (A) Whole cell extracts made from mouse liver were separated on SDS- page gel. (mean±SD, n=10/group) HIF-1 α, PHD, VEGF and GAPDH protein level were determined by immunblotting with the specific antibodies against the proteins listed on the right. GAPDH was used as a loading control. (△indicate P<0.01 when compared with sham group; *indicate P<0.01 when compared with control group; #indicate P<0.01 when compared with IpostC-2 group; ▲indicate P<0.05 when compared with GSP-2 group). (B) HIF-1 α, PHD and VEGF mRNA expression relative to GAPDH were determined by Real-Time PCR. (mean±SD, n=10/group). (△indicate P<0.01 when compared with sham group; *indicate P<0.01 when compared with control group; #indicate P<0.01 when compared with IpostC-2 group; ▲indicate P<0.05 when compared with GSP-2 group, )

