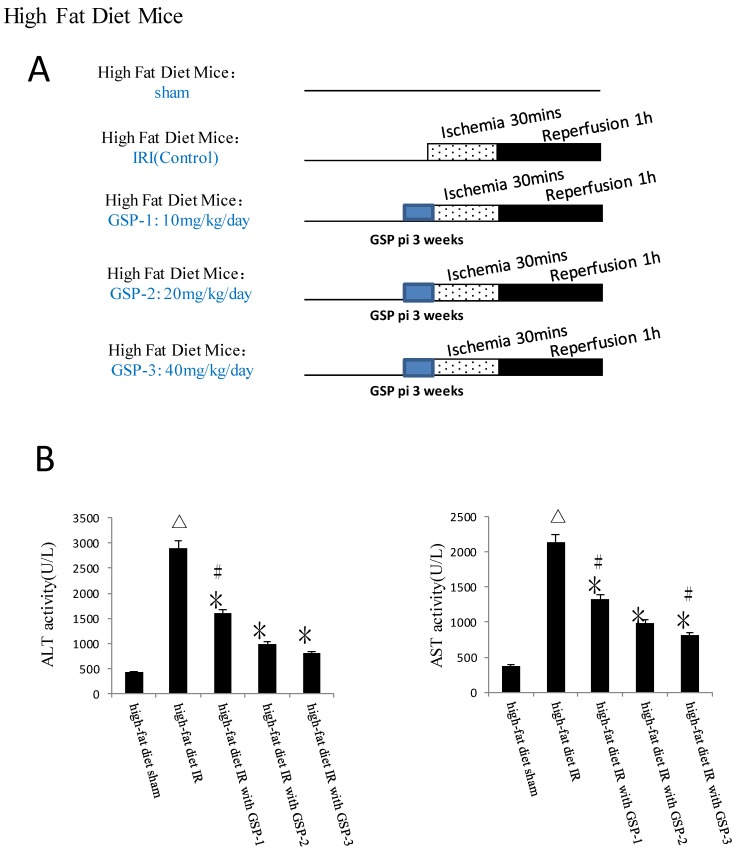
Figure 8.
Effects of GSP on the activities of ALT and AST in obese mice under hepatic IRI. (mean±SD, n=10/group) (△indicate P<0.01 when compared with high-fat diet sham group; *indicate P<0.01 when compared with high-fat diet IR group; #indicate P<0.01 when compared with high-fat diet with GSP-2 group).

