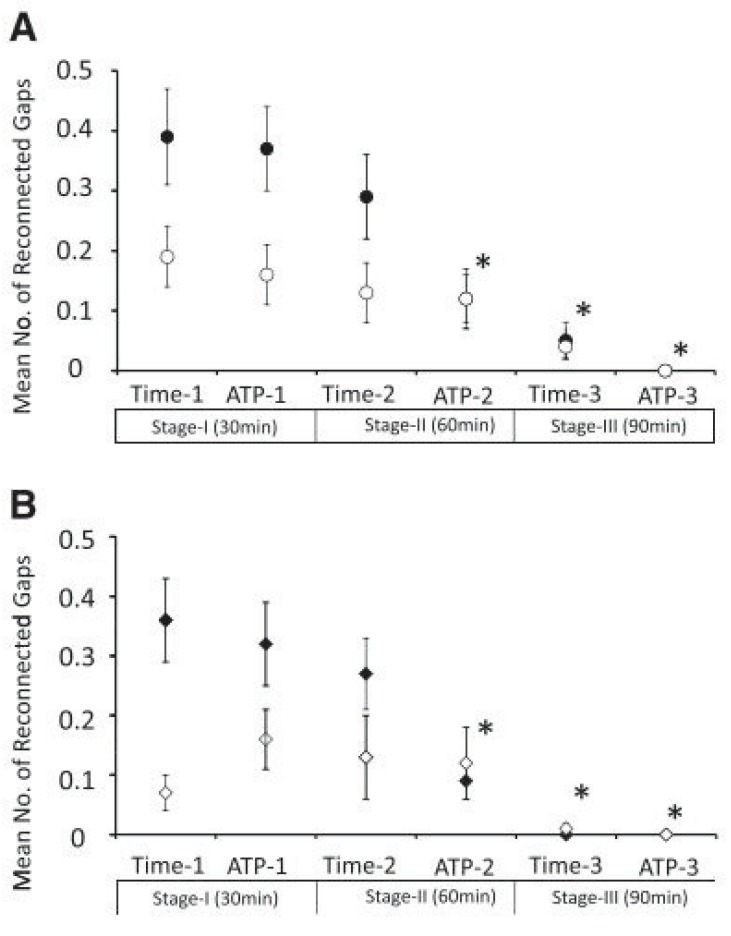
Fig. (1).
Demonstration of the mean number of reconducting gaps at each provocation step. A: right superior (●) and right inferior (○) pulmonary vein. B: left superior (♦) and left inferior (◊) pulmonary vein. In both the right and left superior pulmonary veins, the number of reconducting gaps was significantly smaller at ATP 2, time 3, and ATP 3 compared with that of time 1(*p<0.01). Adapted from Yamane et al. [35].

