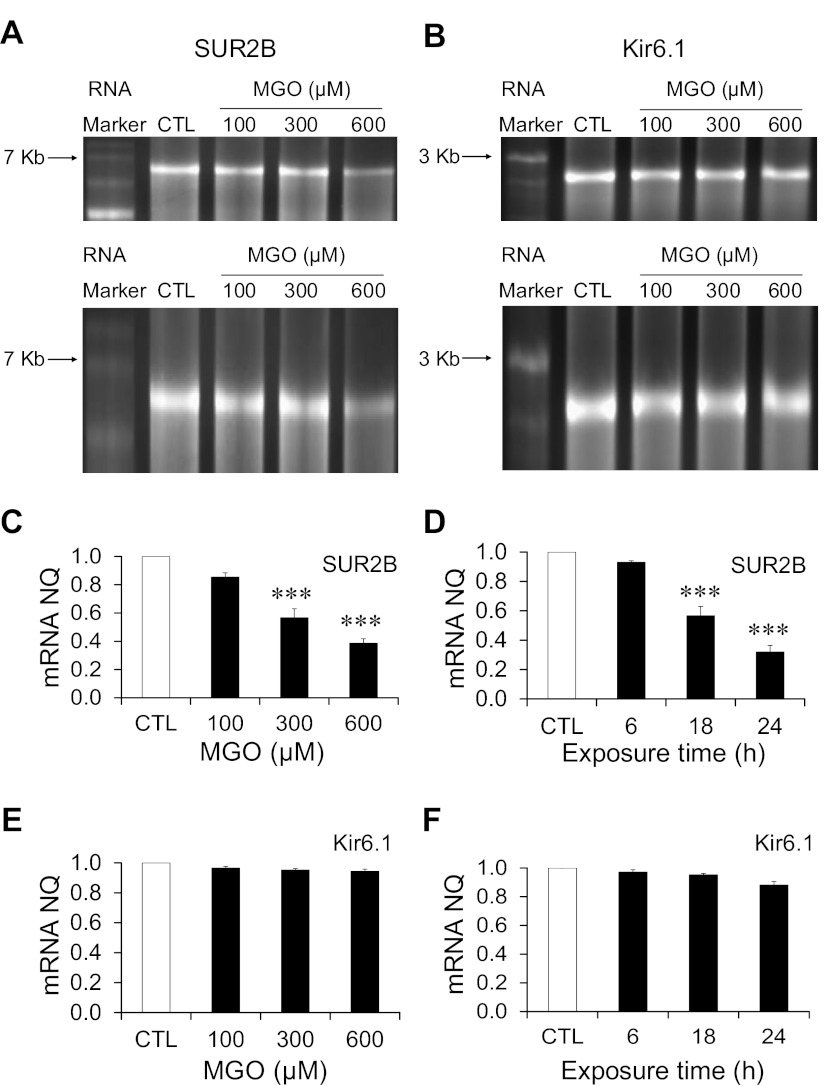
Fig. 5.
Effects of MGO on the coding region of the Kir6.1 and SUR2B mRNAs. Kir6.1 and SUR2B mRNAs were synthesized by in vitro transcription and treated with different concentrations of MGO. A and B, top: gel image of SUR2B and Kir6.1 mRNAs treated with 100, 300, and 600 μM MGO, respectively, along with sham-treated mRNA as control for 18 h. A and B, bottom: vertical elongation images of SUR2B and Kir6.1 gel images from the corresponding top. RNA band sizes on the RNA marker are labeled at left. C: summary of normalized quantity (NQ) of SUR2B mRNA following MGO treatment (100, 300, and 600 μM) for 18 h. D: summary of NQ of SUR2B mRNA treated with 300 μM MGO for different time periods (6, 18 and 24 h). E: summary of NQ of Kir6.1 mRNA following MGO treatment (100, 300, and 600 μM) for 18 h. F: summary of NQ of Kir6.1 mRNA treated with 300 μM MGO for different time points (6, 18, and 24 h). ***P < 0.001 (n = 4 experiments).

