Figure 3.

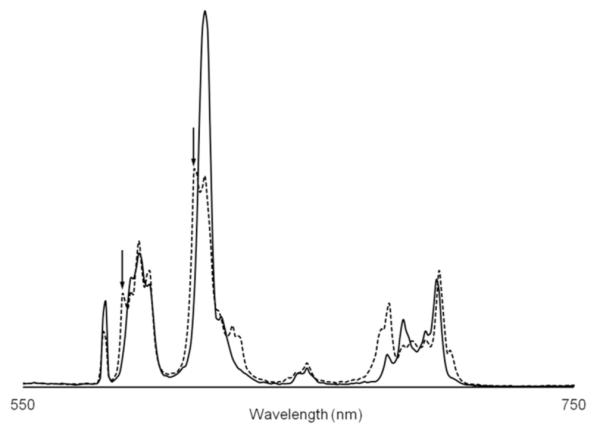
Comparison of emission spectra of 1 at pH 4.4 (solid line) and pH 7.4 (dashed line) (0.5 mM 1, 50 mM citrate, 50 mM phosphate, λex = 395 nm). Arrows point to peaks that may result from an second Eu(III) environment.

Comparison of emission spectra of 1 at pH 4.4 (solid line) and pH 7.4 (dashed line) (0.5 mM 1, 50 mM citrate, 50 mM phosphate, λex = 395 nm). Arrows point to peaks that may result from an second Eu(III) environment.