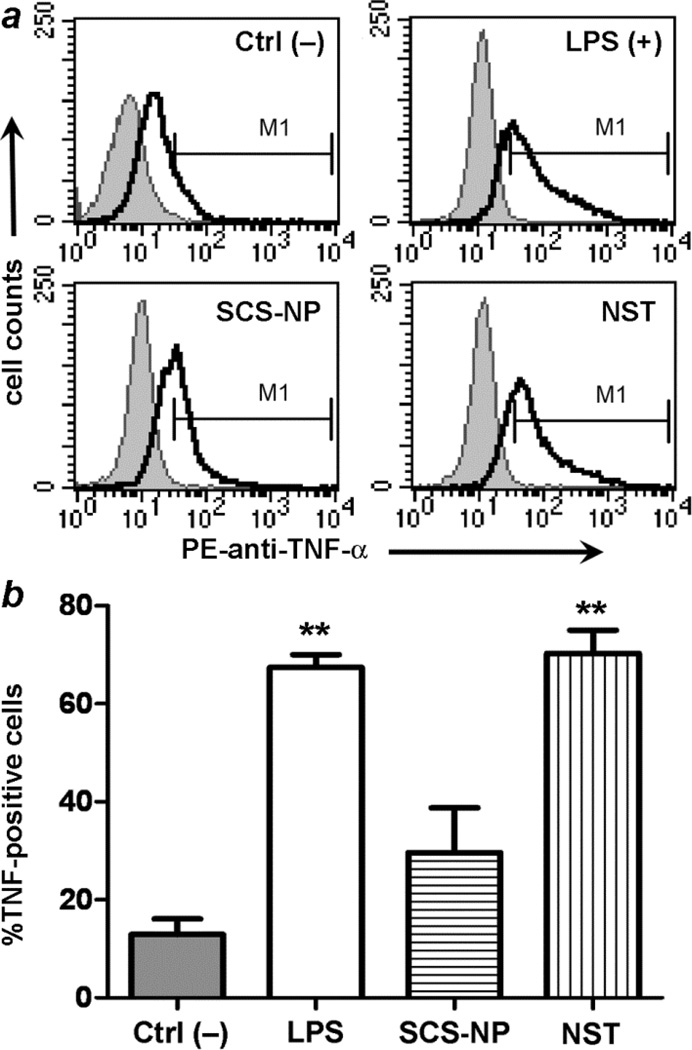
Fig. 5.
(a) Flow cytometry data indicating TNF-α levels in RAW cells: untreated cells (negative control, upper left); LPS-treated cells (upper right); cells incubated with BSA-stabilized SCS-NPs (lower right); cells incubated with BSA-stabilized NSTs (lower left). (b) Histogram representing TNF-α levels in RAW cells. LPS and BSA-stabilized NSTs stimulated TNF-α production, relative to Ctrl– (p < 0.01, **).

