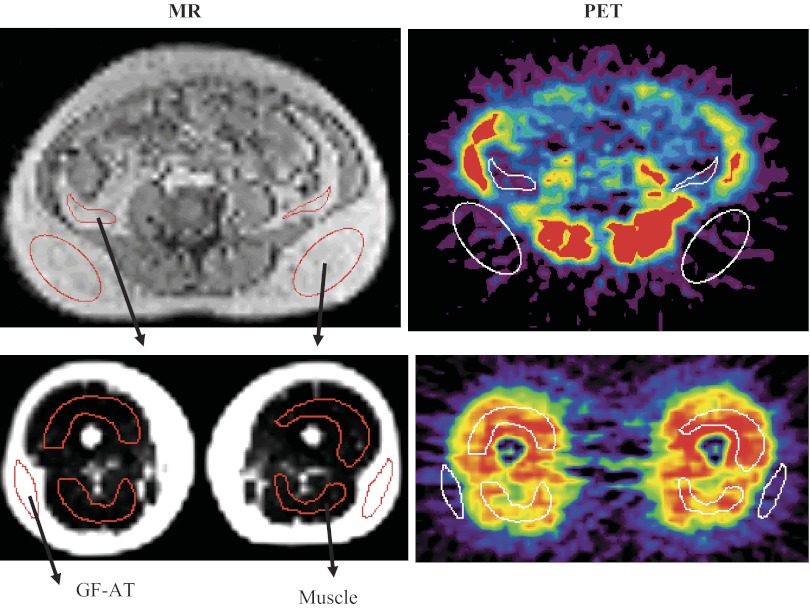
Fig. 2.
Representative PET and MRI. Imaging with region of interest (ROI) placement. An example illustrating MRI and dynamic PET imaging after injection of [18F]FDG. Top pictures represent abdominal imaging, and bottom pictures represent thigh imaging, with MR images on the left and PET images on the right. After MR-PET coregistration, ROI (shown as red ovals) were generated on the MR image and applied to the corresponding coregistered PET image (shown as white ovals) to generate regional FDG time activity curves. GFAT, gluteal-femoral adipose tissue.

