. 2012 Nov 13;1:e00011. doi: 10.7554/eLife.00011

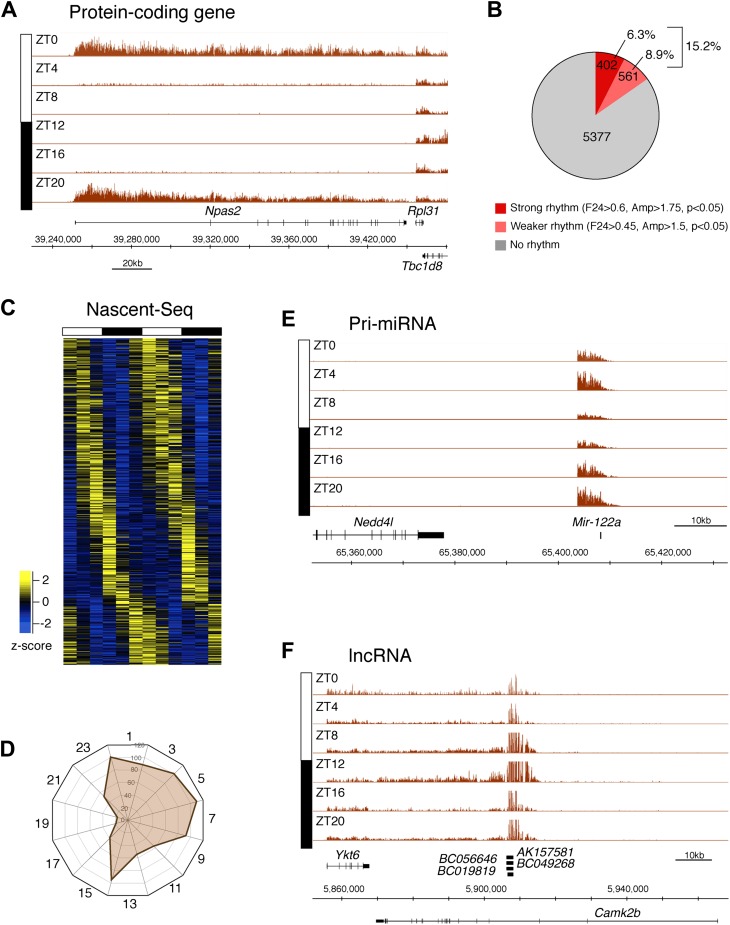
Figure 2. Genome-wide analysis of rhythmic transcription in the mouse liver.

(A): Visualization of Npas2 Nascent-Seq signal at six time points of the light:dark cycle (first replicate). Npas2 Nascent-Seq signal is rhythmic and peaks at ZT20-ZT0, contrary to the signal within the adjacent gene Rpl31. (B): Quantification of the number of genes that are rhythmically transcribed in the mouse liver. Genes with more than three reads per base pair for at least one time point were included for the analysis. Genes are considered to be rhythmically transcribed if signal amplitude (Amp) is greater than 1.5, if signals for the 12 time points follow a sinusoid curve (F24 > 0.45) and if the F24 value is in the top 5% of all F24 values calculated after time points were permutated 10,000 times (p<0.05). A rhythm was considered to be strong (dark red) if F24 > 0.6 and Ampl > 1.75. (C): Heatmap representation of Nascent-Seq signal for the 963 genes that are rhythmically transcribed in the mouse liver. High expression is displayed in yellow (z-score > 1), low expression in blue (z-score < 1). (D): Expression phase of rhythmically expressed nascent RNA (n = 936) was separated by bins of 2 hr. Analysis of their distribution reveals that fewer genes are transcribed at ZT16-20. (E) and (F): Rhythmic Nascent-Seq signal was detected for many precursors of non-coding RNAs such as pri-miRNA (d, pri-miR122a) and long non-coding RNA(e, lin-ncRNAs BC019819, AK157581, BC049268, BC056646).

DOI: http://dx.doi.org/10.7554/eLife.00011.004

Figure 2—source data 1. Gene expression values for all UCSC genes from our mouse liver Nascent-Seq dataset.
elife00011s001.txt (1.1MB, txt)
DOI: 10.7554/eLife.00011.005

Figure 2.

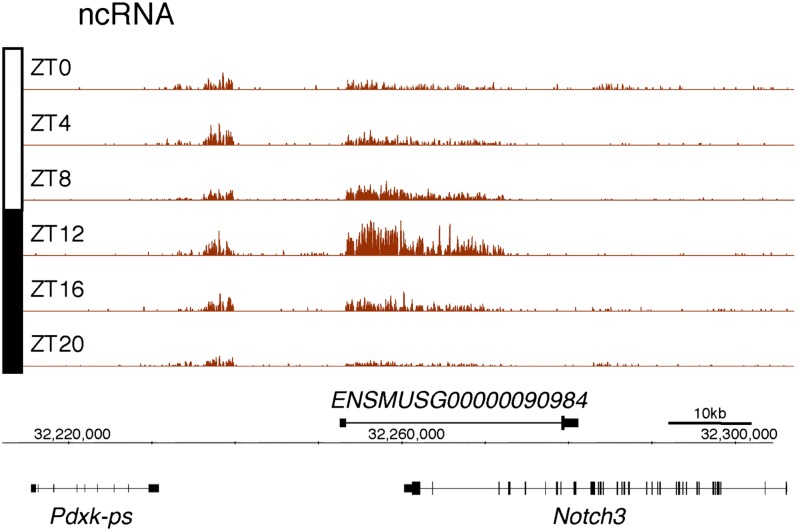
Figure 2—figure supplement 1. Rhythmic transcription of lncRNA ENSMUSG00000098984 in the mouse liver.

Figure 2—figure supplement 1.

Visualization of Nascent-Seq signal (brown; six time points of replicate 1) for the long non-coding RNA (lncRNA) precursor ENSMUSG00000098984. Genes above the scale bar are transcribed from left to right and those below the scale bar are transcribed from right to left.
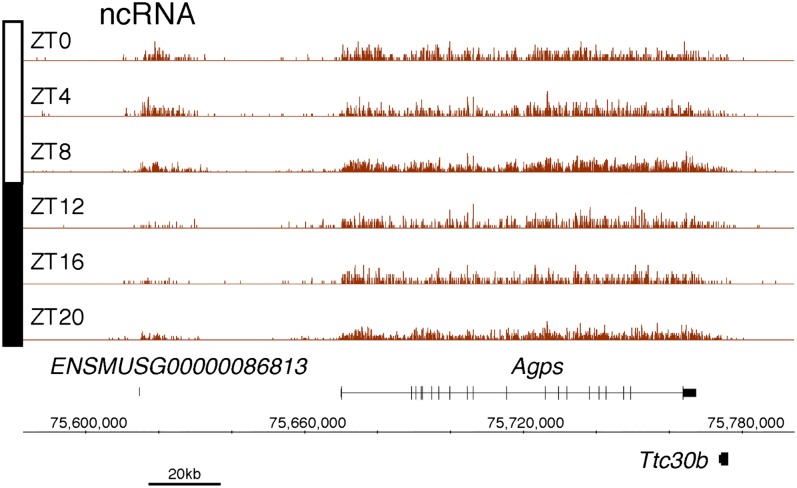
Figure 2—figure supplement 2. Rhythmic transcription of lncRNA ENSMUSG00000086813 in the mouse liver.

Figure 2—figure supplement 2.

Visualization of Nascent-Seq signal (brown; six time points of replicate 1) for the long non-coding RNA (lncRNA) precursor ENSMUSG00000086813. Genes above the scale bar are transcribed from left to right and those below the scale bar are transcribed from right to left.
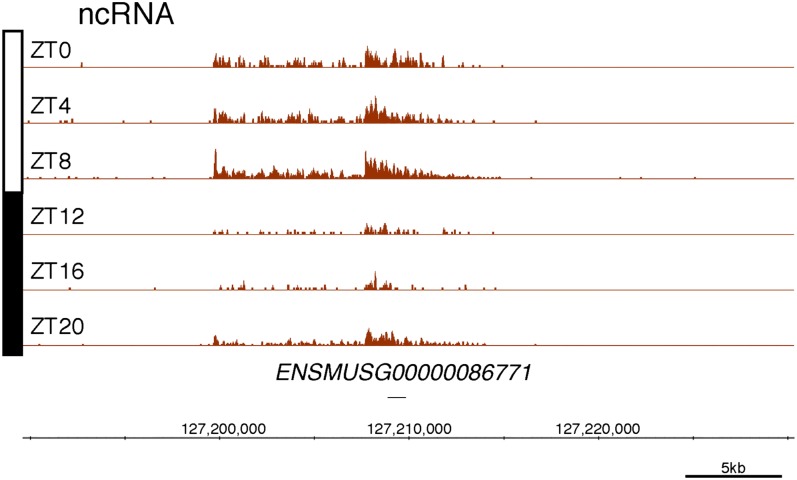
Figure 2—figure supplement 3. Rhythmic transcription of lncRNA ENSMUSG00000086771 in the mouse liver.

Figure 2—figure supplement 3.

Visualization of Nascent-Seq signal (brown; six time points of replicate 1) for the long non-coding RNA (lncRNA) precursor ENSMUSG00000086771. Genes above the scale bar are transcribed from left to right and those below the scale bar are transcribed from right to left.
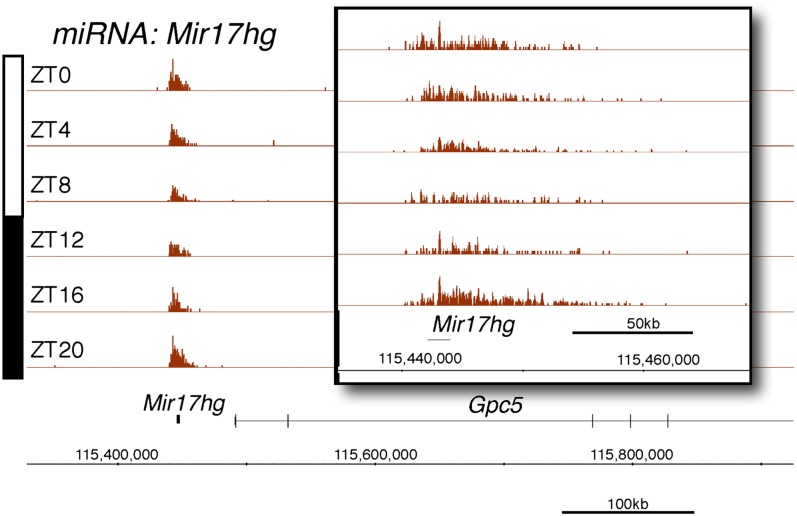
Figure 2—figure supplement 4. Rhythmic transcription of pri-miRNA pri-Mir17hg in the mouse liver.

Figure 2—figure supplement 4.

Visualization of Nascent-Seq signal (brown; six time points of replicate 1) for the pri-miRNA pri-Mir17hg. Enlargement of pri-miRNA signal reveals that pri-miRNA transcription units are not well annotated, precluding a rigorous quantification of the signal Genes above the scale bar are transcribed from left to right and those below the scale bar are transcribed from right to left.
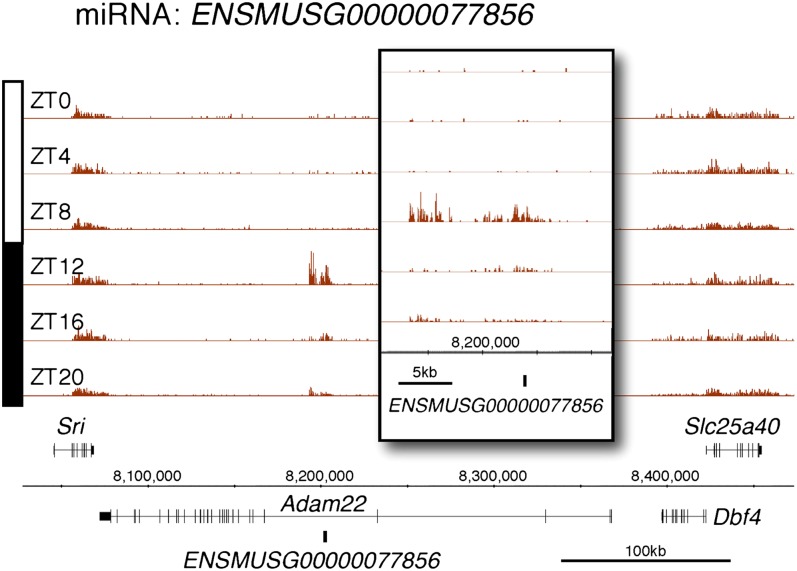
Figure 2—figure supplement 5. Rhythmic transcription of pri-miRNA ENSMUSG00000077856 in the mouse liver.

Figure 2—figure supplement 5.

Visualization of Nascent-Seq signal (brown; six time points of replicate 1) for the pri-miRNA ENSMUSG00000077856. Enlargement of pri-miRNA signal reveals that pri-miRNA transcription units are not well annotated, precluding a rigorous quantification of the signal. Genes above the scale bar are transcribed from left to right and those below the scale bar are transcribed from right to left.
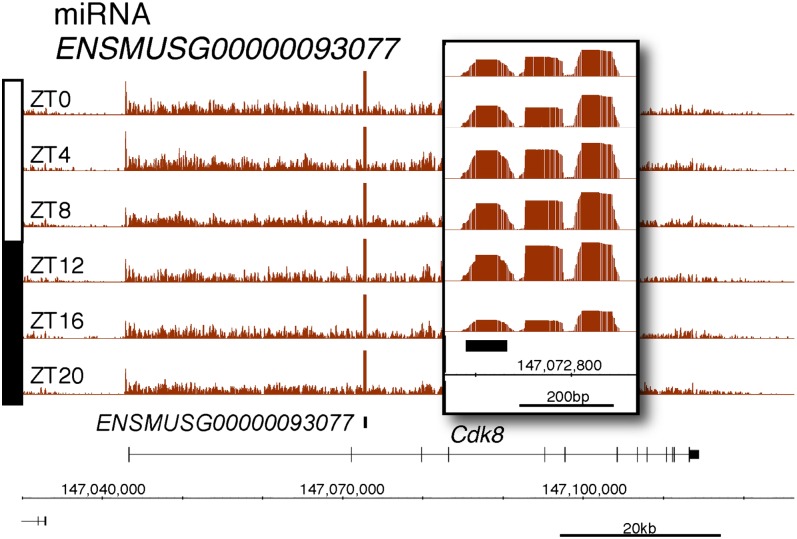
Figure 2—figure supplement 6. Rhythmic transcription of pri-miRNA ENSMUSG00000093077 in the mouse liver.

Figure 2—figure supplement 6.

Visualization of Nascent-Seq signal (brown; six time points of replicate 1) for the pri-miRNA ENSMUSG00000093077. Enlargement of pri-miRNA signal reveals that pri-miRNA transcription units are not well annotated, precluding a rigorous quantification of the signal. Genes above the scale bar are transcribed from left to right and those below the scale bar are transcribed from right to left.