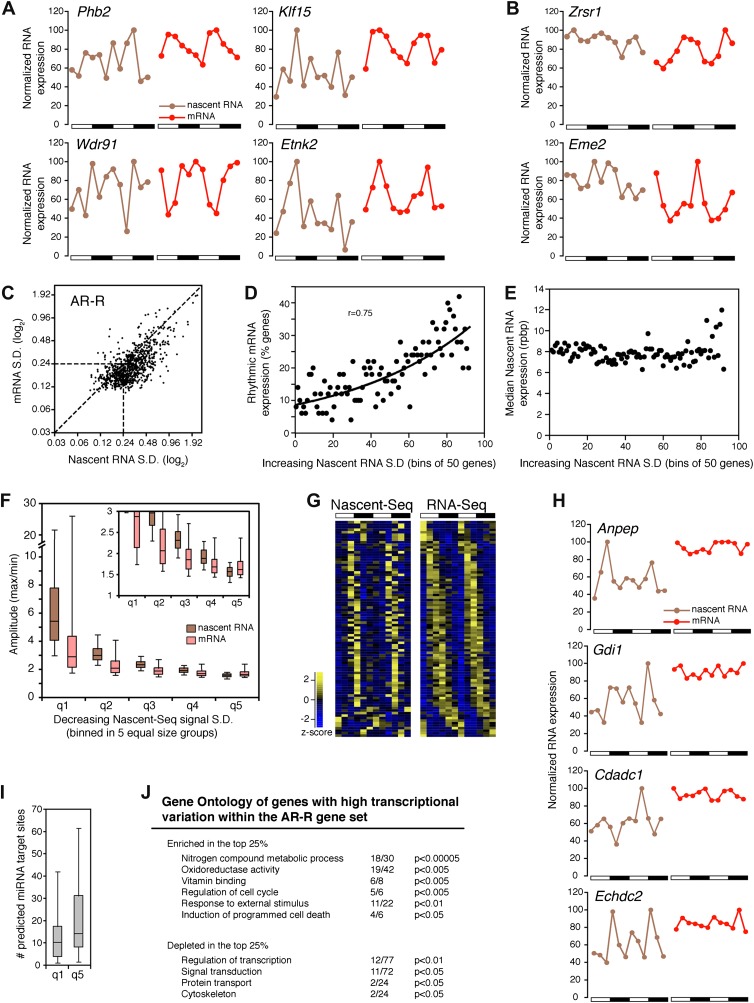
Figure 6. Transcriptional variability of AR-R genes contributes to rhythmic mRNA expression.
(A) and (B): Nascent RNA levels (brown; time points every 4 hr starting at ZT0) and mRNA levels (red; time points every 4 hr starting at ZT2) from the Nascent-Seq and RNA-Seq datasets for six genes of the AR-R gene set. While the majority of the AR-R genes exhibit variable nascent RNA expression (A), some of them exhibit a relatively constant transcription when compared to mRNA expression (B). (C): Standard deviation (SD; calculated using the 12 time points and normalized to the mean) of nascent RNA expression is higher than the SD normalized to the mean of mRNA levels for most AR-R genes. (D) and (E): Higher transcriptional variability (SD) of arrhythmically transcribed genes is associated with higher occurrence of rhythmic mRNA expression (D), but not to nascent RNA expression levels (E). (F): Higher variability of transcription for the genes of the AR-R group is associated with increase amplitude of rhythms at both Nascent RNA (brown) and mRNA (red) level. Genes of the AR-R group (n = 862) were binned into five quintiles of equal size (q1–q5). (G): Heatmap representation of 86 AR-R genes that exhibit high level of transcription at only one time point, and with rhythmic mRNA expression. High expression is displayed in yellow (z-score > 1), low expression in blue (z-score < 1). (H): Nascent RNA levels (brown) and mRNA levels (red) for four AR-AR genes with variable nascent RNA expression that is not associated to rhythmic mRNA expression. (I): Number of predicted miRNA target sites of AR-R genes with high transcriptional variability (q1, top 20% of the 826 AR-R genes) and low transcriptional variability (q5, bottom 20%). (J): Gene ontology of AR-R genes with high transcriptional variability (top 25%) when compared to all AR-R genes. Significant enrichment (top) and depletion (bottom) of biological functions for these genes are displayed. Values correspond to the number of genes within this top 25% of genes, when compared to all AR-R genes.
DOI: http://dx.doi.org/10.7554/eLife.00011.017

