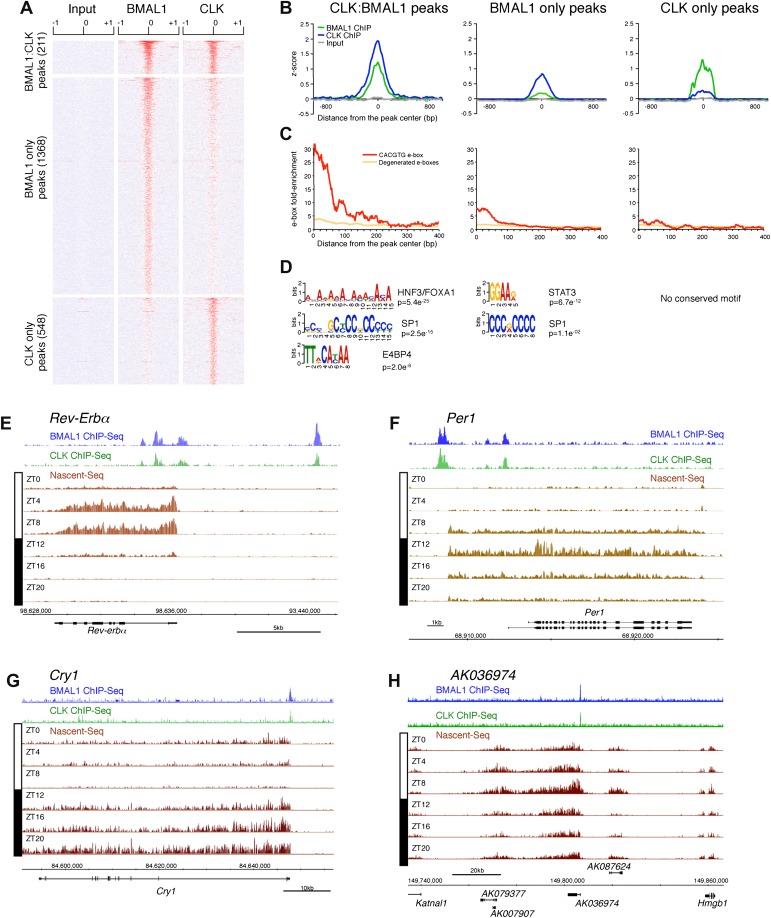
Figure 7. Characterization of CLK and BMAL1 target genes in the mouse liver.
(A) and (B): Visualization (A) and quantification (B) of BMAL1 ChIP-Seq, CLK ChIP-Seq and input signal at BMAL1 and CLK significant peaks (analysis using MACS algorithm). BMAL1 ChIP-Seq, CLK ChIP-Seq and Input signals were retrieved based on the location of the BMAL1 peaks (center ± 1kb, for CLK:BMAL1 peaks and BMAL1 only peaks) or the CLK peaks (center ± 1kb, for CLK only peaks). Normalization was performed on the entire datasets by calculating the z-score ((x − mean)/SD). Heatmap displays high expression in red and low expression in blue. Quantification (B) was performed by averaging the z-score by bins of 25 bp for all CLK:BMAL1 peaks (n = 211), BMAL1 only peaks (n = 1368) and CLK only peaks (n = 548). (C): Enrichment of e-boxes (perfect CACGTG in red, degenerated e-boxes [one nucleotide mismatch, in orange]) within ±500 bp of CLK:BMAL1, BMAL1 only and CLK only peak centers. (D): Motifs enriched within CLK:BMAL1 peaks, BMAL1 only peaks and CLK only peaks, as revealed by MEME analysis. (E)–(H): Visualization of BMAL1 ChIP-Seq (blue), CLK ChIP-Seq (green) and Nascent-Seq (brown; six time points of replicate 1) signals for Rev-Erbα (E), Per1 (F), Cry1 (G) and a cluster of 4 lncRNA (AK079377, AK007907, AK036974, AK087624) (H) targeted by CLK:BMAL1. Genes above the scale bar are transcribed from left to right and those below the scale bar are transcribed from right to left.

