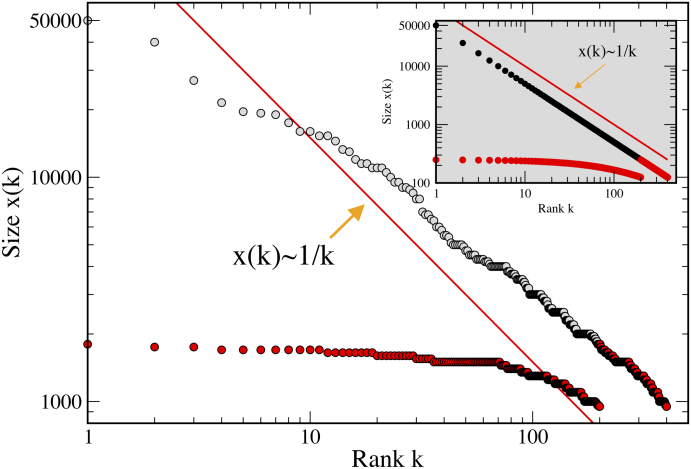
Figure 2. Zipf’s Law for the Richest Billionaires in the United States.
The richest 390 persons in the US are billionaires whose wealth we plot
against their rank as the uppermost set of points (the first 195 richest
being grey circles, the second 195 poorest being red circles). The second
set is the sub-sample that we translate to the original ranks and plot as
the set of red circle points below the diagonal straight line which is the
pure Zipf plot associated with  .
The inset is a pure Zipf plot dimensioned to the entire set of 390
billionaires and the poorest sub-sample of 195. (Source: Forbes
List
http://www.forbes.com/).

