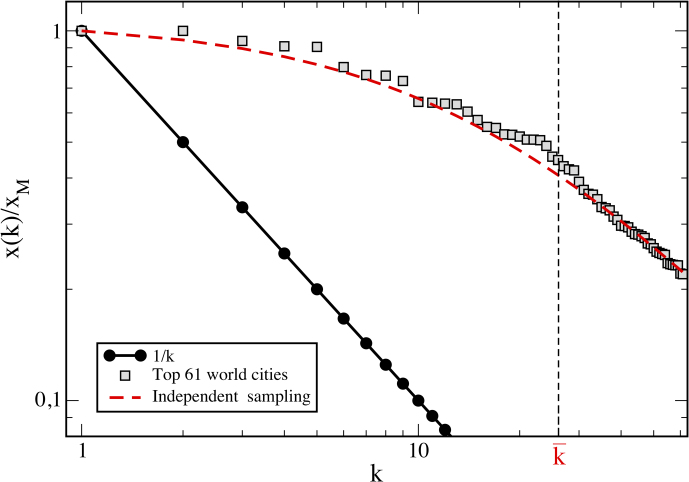
Figure 3. Rank Size of World Cities and Deviation from Zipf’s Law.
The top 61 ‘world cities proper’ normalized as  plotted in the grey squares are used
to compute the modified rank size equation Eq.(3) – dashed red line
– compared to the pure rank size equation
  which is the solid black line. Note the value
of
  , below which values do not
accord to Zipf’s Law in contrast to those above. The data is from the
compilation of 65 separate databases (Sources: Wikipedia
http://en.wikipedia.org/wiki/List_of_cities_proper_by_population).

