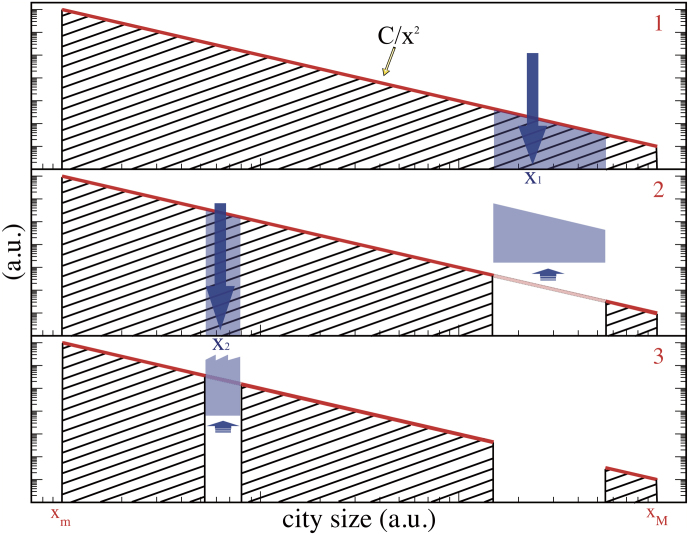
Figure 5. Successive Conditioned Draws.
When we extract an object (or a city size) such as x1, we remove a section (blue slice in panel 1) of the probability density around the drawn value. See the text for the details of how to compute the slice to remove (Eq.7). Then the density moves to the reduced distribution in panel 2 from which the next object is drawn in the same way with the slice associated with x2 being removed in panel 3.

