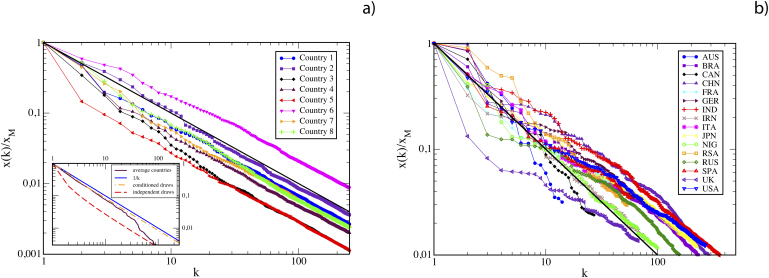
Figure 6. Real (Zipfian) and Sampled Theoretical Rank-Size Law.
Left (a): Eight sets of samples of 250 cities each drawn using the random conditioning algorithm explained in the text, rescaled in order to have the same maximum value and compared with a pure Zipf’s Law (black solid line). In the inset, we report the average rank-size law (dashed orange line) of 200 simulated countries from which the eight reported in the main box are extracted. We compare this with the rank-size rule produced by independent random samplings (red dashed line) and with the average over the 16 countries of panel b) (maroon solid line). We observe that the conditioned sampling algorithm produces a striking result very close to a pure Zipf ‘s Law (blue solid line). Right (b): Rank-size rules for the cities in 16 world countries collapsed in order to have the same maximum values and comparable with Zipf’s Law for the same (black solid line) (Source: Wolfram Mathematica online database).

