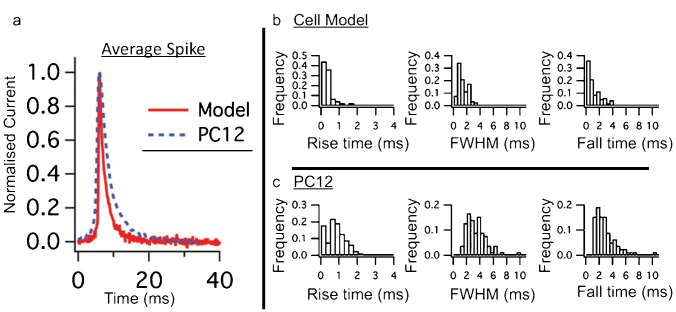
Figure 2.
(a) Normalized average exocytosis event spikes for the artificial cell model (red) and for a PC12 cell (blue). (b) and (c) Histograms showing distributions of spike kinetics for the artificial cell model (b, nmodel = 113) and a PC12 cell (c, nPC12 = 78). The displayed spike features are the rise time, calculated as the time it takes for the current to rise from 25% of its maximum value to 75%, the full width at half maximum (FWHM) current value and the fall time, calculated as the time it takes for the current to fall from 75% of its maximum value to 25%. The average values of these parameters are listed in Table 1.

