Figure 1.

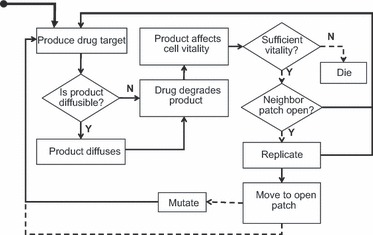
A graphical representation of the flow of events for each cell during each time step within the computational model. Dashed lines denote stochastic steps not always taken.

A graphical representation of the flow of events for each cell during each time step within the computational model. Dashed lines denote stochastic steps not always taken.