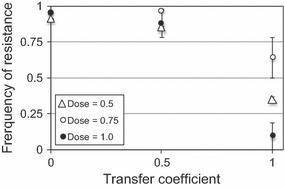
Figure 2.

Simulation results: Frequency of the drug resistance mutation averaged over last 1000 cell generations. Each marker represents the mean for a different drug concentration. High transfer coefficients correspond to drug targets that are more ‘public’ or more widely shared among cells. A value of zero corresponds to a cell-intrinsic drug target. Markers show the mean, and bars show the standard error across 10 simulation runs with different seed values for the pseudorandom number generator.
