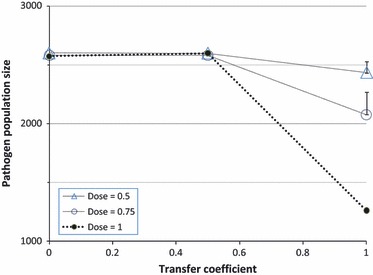
Figure 4.

Simulation results: Mean size of total pathogen population, averaged over last 1000 cell generations. A value of zero for transfer coefficient represents a cell-intrinsic drug target. Markers show means, and bars show standard errors across 10 simulation runs with different seed values for the pseudorandom number generator. (Some error bars are too small to be visible.) Results are shown for three different drug concentrations.
