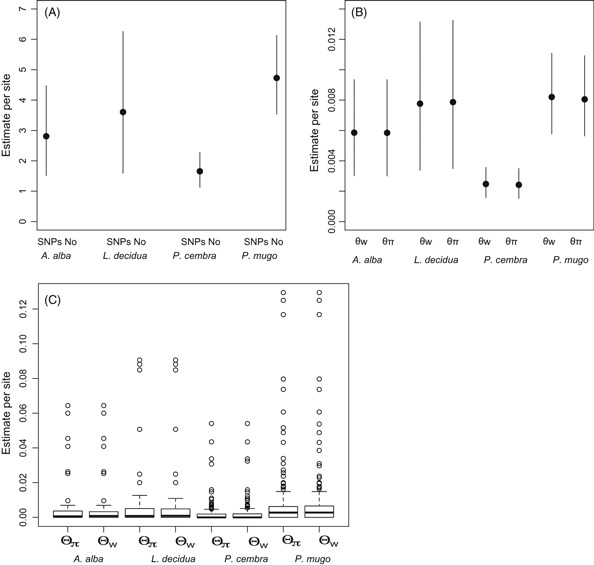
Figure 2.

Mean values of (A) number of SNPs and (B) nucleotide diversity (θw, θπ) with the bootstrapped 95% confidence intervals and (C) distribution of nucleotide diversity in candidate genes for the different species. The box shows the upper and lower quartiles, while the line represents the median of the sample.
