
Figure 6.
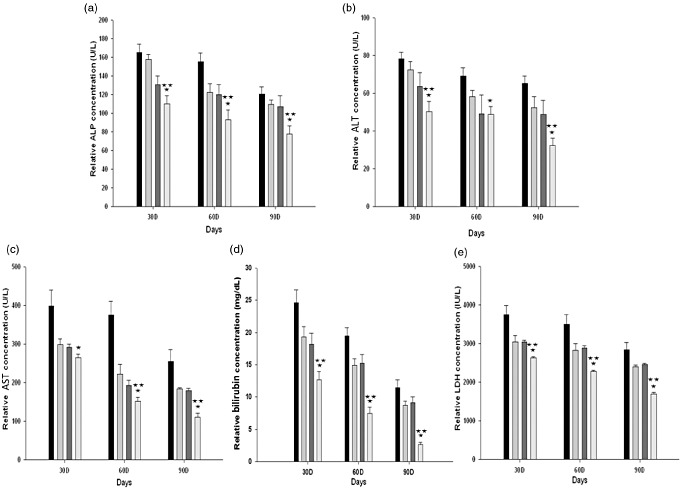
Comparison of serum hepatic enzyme levels after transplantation. Mean values of alkaline phosphatase (ALP) (a), alanine aminotransferase (ALT) (b), aspartate aminotransferase (AST) (c), bilirubin (d), and lactate dehydrogenase (LDH) (e) as a function of post-transplantation on days 30, 60, and 90. *Versus phosphate-buffered saline (PBS); **versus mesenchymal stem cells (MSC) and MSC/vector groups (P < 0.05). ( ) PBS, (
 ) MSC, (
 )pIRES–enhanced green fluorescent protein/MSC, (
 ) human forkhead box A2 (hFoxa2)/MSC.