
Figure 1. The effect of apoA-V expression on TG fate in McA-RH7777 cells.
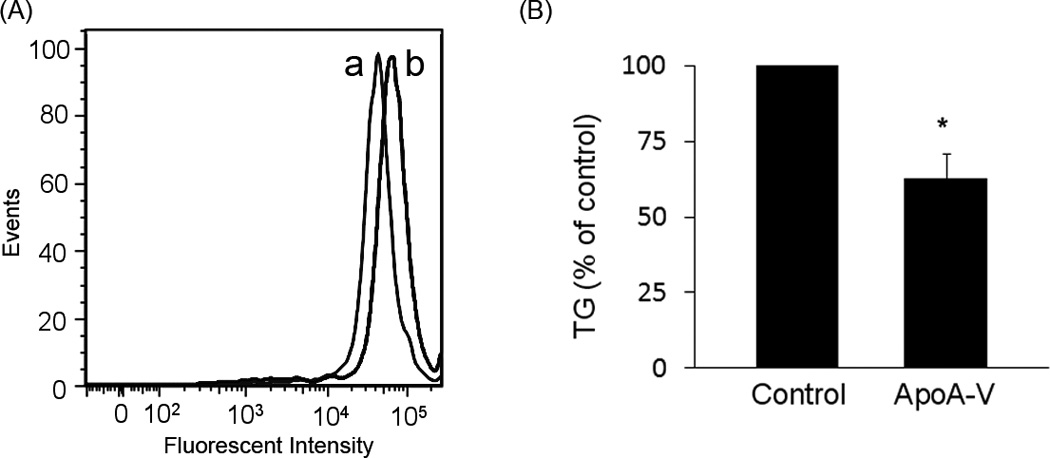
Panel A) Stably transfected McA-RH7777 cells were detached from plates, fixed with 4% paraformaldehyde, washed with PBS and stained with Nile Red prior to flow cytometry. Curve (a) depicts the fluorescence intensity of cells transfected with pcDNA 3.1 control vector while curve (b) shows intensity of cells transfected with human apoA-V pcDNA 3.1. Panel B) Cells were incubated with serum-free medium 24 h prior to harvesting conditioned media. The conditioned media were concentrated, dialyzed against PBS and TG content measured. Values are presented as percentage of TG secreted by control cells expressed as mean ± S.E.M. (n=3). Student t-test was used to examine statistical difference between apoA-V expressing cells and control cells; *, p ≤ 0.05.