
Figure 3. Flow cytometry and confocal fluorescence microscopy analysis of McA-RH7777 clonal cell lines.
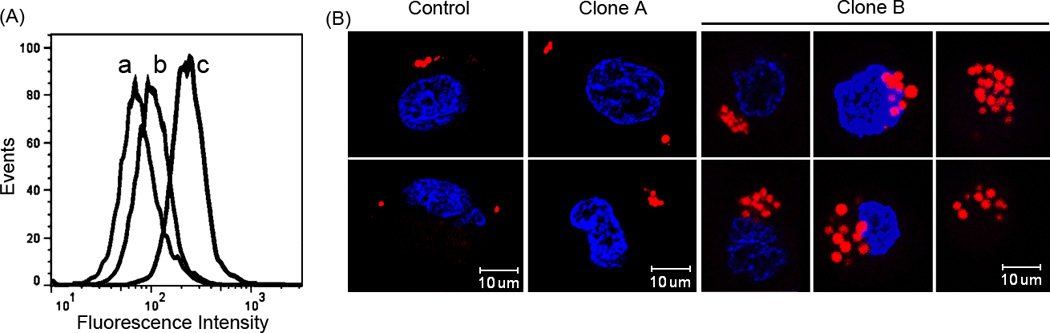
Panel A: Human apoA-V expressing and control pcDNA 3.1 cells lines were detached from plates at 30% confluence, washed with PBS, fixed and stained with Nile Red prior to flow cytometry. Curve a) Control cells transfected with empty vector; curve b) clonal cell line A; and curve c) clonal cell line B. Panel B: Representative confocal fluorescence microscopy images of stable transfected McA-RH7777 cells. Cells were stained with Nile Red and Hoechst nuclear stain prior to microscopy. Left) control cells transfected with empty vector; middle) Clone A cells; right) Clone B cells.